Japanese vs Immigrants from Belize Single Mother Poverty
COMPARE
Japanese
Immigrants from Belize
Single Mother Poverty
Single Mother Poverty Comparison
Japanese
Immigrants from Belize
28.9%
SINGLE MOTHER POVERTY
68.0/ 100
METRIC RATING
160th/ 347
METRIC RANK
31.4%
SINGLE MOTHER POVERTY
0.2/ 100
METRIC RATING
267th/ 347
METRIC RANK
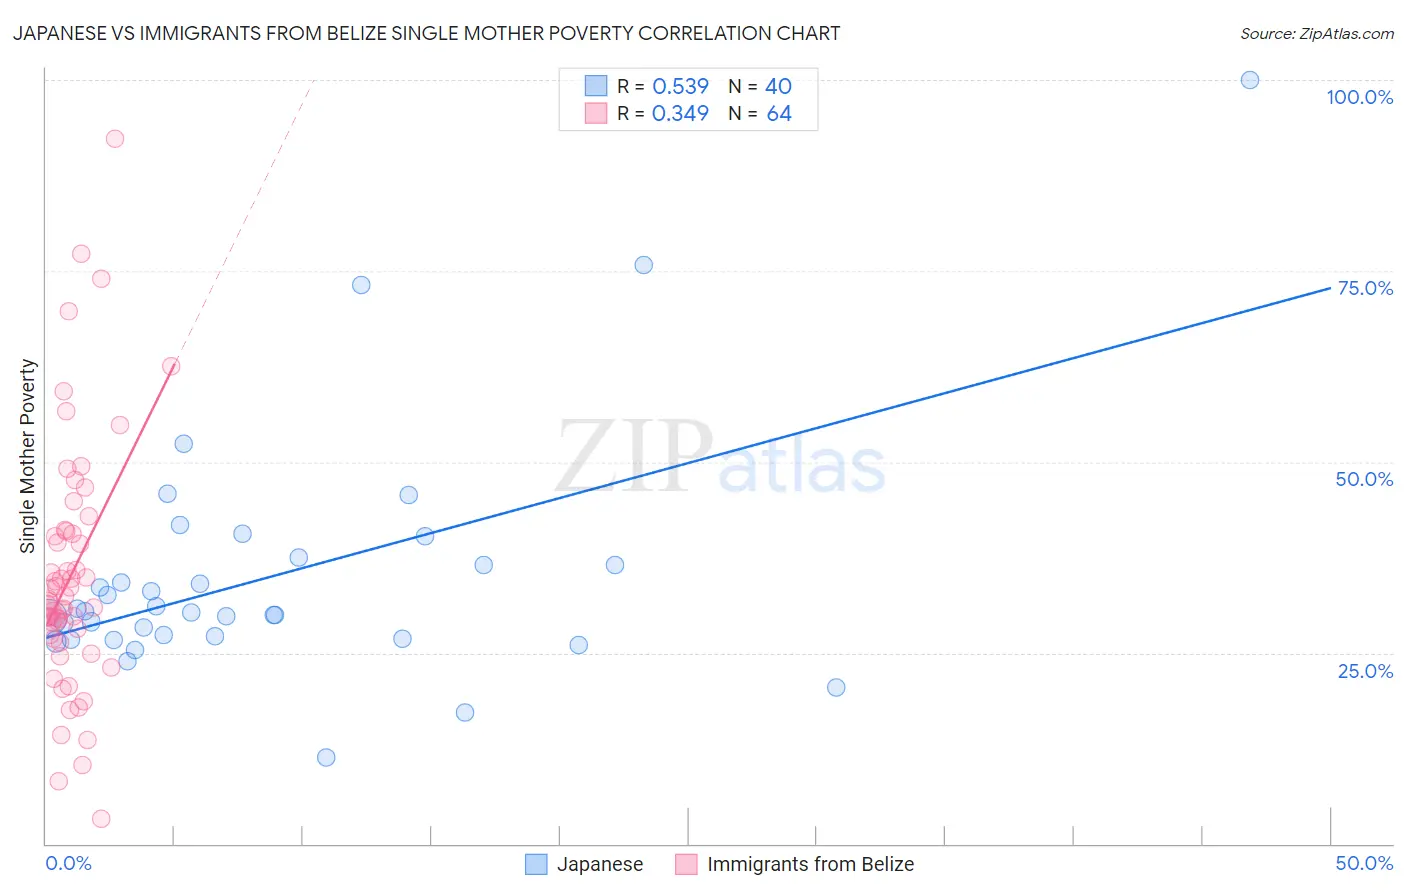
Japanese vs Immigrants from Belize Single Mother Poverty Correlation Chart
The statistical analysis conducted on geographies consisting of 246,409,359 people shows a substantial positive correlation between the proportion of Japanese and poverty level among single mothers in the United States with a correlation coefficient (R) of 0.539 and weighted average of 28.9%. Similarly, the statistical analysis conducted on geographies consisting of 129,542,917 people shows a mild positive correlation between the proportion of Immigrants from Belize and poverty level among single mothers in the United States with a correlation coefficient (R) of 0.349 and weighted average of 31.4%, a difference of 8.7%.
Single Mother Poverty Correlation Summary
| Measurement | Japanese | Immigrants from Belize |
| Minimum | 11.3% | 3.2% |
| Maximum | 100.0% | 92.3% |
| Range | 88.7% | 89.1% |
| Mean | 35.2% | 35.1% |
| Median | 30.4% | 31.7% |
| Interquartile 25% (IQ1) | 27.0% | 27.1% |
| Interquartile 75% (IQ3) | 37.0% | 40.7% |
| Interquartile Range (IQR) | 10.0% | 13.5% |
| Standard Deviation (Sample) | 16.1% | 16.3% |
| Standard Deviation (Population) | 15.9% | 16.1% |
Similar Demographics by Single Mother Poverty
Demographics Similar to Japanese by Single Mother Poverty
In terms of single mother poverty, the demographic groups most similar to Japanese are Czech (28.9%, a difference of 0.020%), Immigrants from Cambodia (28.9%, a difference of 0.080%), Scandinavian (28.9%, a difference of 0.10%), Immigrants from Nigeria (28.9%, a difference of 0.11%), and Immigrants from Kenya (28.9%, a difference of 0.11%).
| Demographics | Rating | Rank | Single Mother Poverty |
| Slovenes | 76.4 /100 | #153 | Good 28.8% |
| Portuguese | 73.2 /100 | #154 | Good 28.8% |
| Ugandans | 71.7 /100 | #155 | Good 28.8% |
| Iraqis | 71.5 /100 | #156 | Good 28.8% |
| Immigrants | Western Europe | 71.1 /100 | #157 | Good 28.9% |
| Immigrants | Hungary | 70.6 /100 | #158 | Good 28.9% |
| Czechs | 68.4 /100 | #159 | Good 28.9% |
| Japanese | 68.0 /100 | #160 | Good 28.9% |
| Immigrants | Cambodia | 66.6 /100 | #161 | Good 28.9% |
| Scandinavians | 66.2 /100 | #162 | Good 28.9% |
| Immigrants | Nigeria | 65.9 /100 | #163 | Good 28.9% |
| Immigrants | Kenya | 65.9 /100 | #164 | Good 28.9% |
| Arabs | 60.7 /100 | #165 | Good 29.0% |
| Inupiat | 60.4 /100 | #166 | Good 29.0% |
| Costa Ricans | 58.4 /100 | #167 | Average 29.0% |
Demographics Similar to Immigrants from Belize by Single Mother Poverty
In terms of single mother poverty, the demographic groups most similar to Immigrants from Belize are Subsaharan African (31.4%, a difference of 0.15%), Immigrants from Senegal (31.5%, a difference of 0.18%), German Russian (31.3%, a difference of 0.22%), Scotch-Irish (31.5%, a difference of 0.22%), and Immigrants from Ecuador (31.3%, a difference of 0.25%).
| Demographics | Rating | Rank | Single Mother Poverty |
| Whites/Caucasians | 0.3 /100 | #260 | Tragic 31.2% |
| Immigrants | El Salvador | 0.3 /100 | #261 | Tragic 31.2% |
| Hmong | 0.3 /100 | #262 | Tragic 31.2% |
| Bahamians | 0.2 /100 | #263 | Tragic 31.3% |
| Immigrants | Ecuador | 0.2 /100 | #264 | Tragic 31.3% |
| German Russians | 0.2 /100 | #265 | Tragic 31.3% |
| Sub-Saharan Africans | 0.2 /100 | #266 | Tragic 31.4% |
| Immigrants | Belize | 0.2 /100 | #267 | Tragic 31.4% |
| Immigrants | Senegal | 0.1 /100 | #268 | Tragic 31.5% |
| Scotch-Irish | 0.1 /100 | #269 | Tragic 31.5% |
| British West Indians | 0.1 /100 | #270 | Tragic 31.5% |
| Immigrants | Cabo Verde | 0.1 /100 | #271 | Tragic 31.6% |
| Immigrants | Micronesia | 0.1 /100 | #272 | Tragic 31.6% |
| Fijians | 0.1 /100 | #273 | Tragic 31.6% |
| Bangladeshis | 0.1 /100 | #274 | Tragic 31.7% |