Japanese vs Apache Median Female Earnings
COMPARE
Japanese
Apache
Median Female Earnings
Median Female Earnings Comparison
Japanese
Apache
$38,528
MEDIAN FEMALE EARNINGS
8.1/ 100
METRIC RATING
222nd/ 347
METRIC RANK
$34,895
MEDIAN FEMALE EARNINGS
0.0/ 100
METRIC RATING
314th/ 347
METRIC RANK
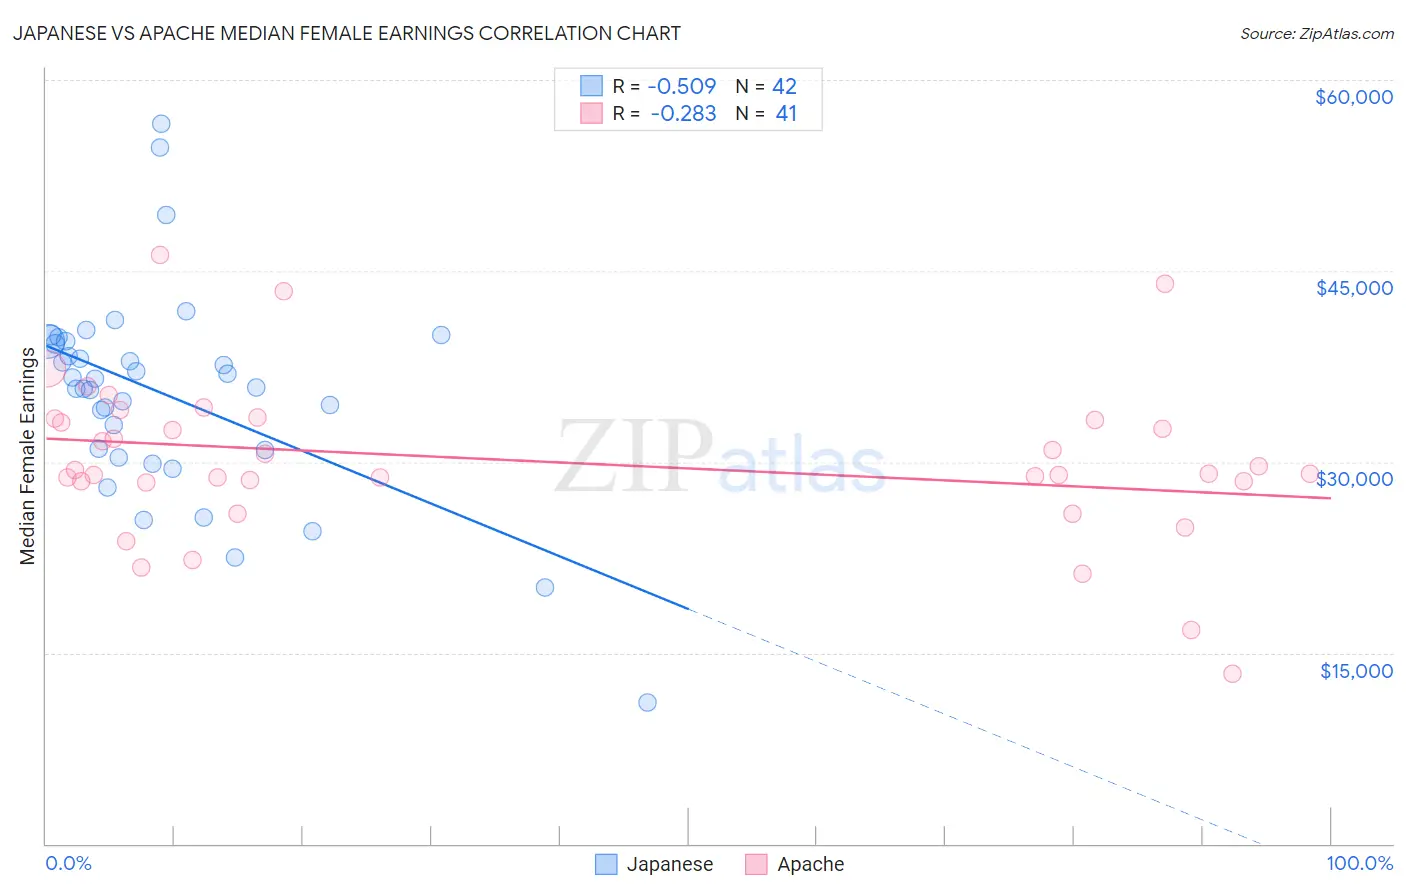
Japanese vs Apache Median Female Earnings Correlation Chart
The statistical analysis conducted on geographies consisting of 249,158,779 people shows a substantial negative correlation between the proportion of Japanese and median female earnings in the United States with a correlation coefficient (R) of -0.509 and weighted average of $38,528. Similarly, the statistical analysis conducted on geographies consisting of 230,997,872 people shows a weak negative correlation between the proportion of Apache and median female earnings in the United States with a correlation coefficient (R) of -0.283 and weighted average of $34,895, a difference of 10.4%.
Median Female Earnings Correlation Summary
| Measurement | Japanese | Apache |
| Minimum | $11,066 | $13,381 |
| Maximum | $56,543 | $46,250 |
| Range | $45,477 | $32,869 |
| Mean | $35,269 | $30,090 |
| Median | $36,190 | $29,044 |
| Interquartile 25% (IQ1) | $30,918 | $28,433 |
| Interquartile 75% (IQ3) | $39,451 | $33,369 |
| Interquartile Range (IQR) | $8,533 | $4,936 |
| Standard Deviation (Sample) | $8,213 | $6,387 |
| Standard Deviation (Population) | $8,115 | $6,309 |
Similar Demographics by Median Female Earnings
Demographics Similar to Japanese by Median Female Earnings
In terms of median female earnings, the demographic groups most similar to Japanese are Immigrants from Sudan ($38,511, a difference of 0.040%), Yugoslavian ($38,573, a difference of 0.12%), Immigrants from the Azores ($38,573, a difference of 0.12%), Native Hawaiian ($38,461, a difference of 0.17%), and Nepalese ($38,603, a difference of 0.19%).
| Demographics | Rating | Rank | Median Female Earnings |
| Spaniards | 10.3 /100 | #215 | Poor $38,656 |
| Immigrants | Ecuador | 10.1 /100 | #216 | Poor $38,644 |
| Immigrants | Jamaica | 9.7 /100 | #217 | Tragic $38,625 |
| Cape Verdeans | 9.5 /100 | #218 | Tragic $38,614 |
| Nepalese | 9.3 /100 | #219 | Tragic $38,603 |
| Yugoslavians | 8.8 /100 | #220 | Tragic $38,573 |
| Immigrants | Azores | 8.8 /100 | #221 | Tragic $38,573 |
| Japanese | 8.1 /100 | #222 | Tragic $38,528 |
| Immigrants | Sudan | 7.8 /100 | #223 | Tragic $38,511 |
| Native Hawaiians | 7.1 /100 | #224 | Tragic $38,461 |
| French | 7.0 /100 | #225 | Tragic $38,457 |
| French Canadians | 6.8 /100 | #226 | Tragic $38,436 |
| Scottish | 6.3 /100 | #227 | Tragic $38,397 |
| Sub-Saharan Africans | 6.2 /100 | #228 | Tragic $38,391 |
| Belgians | 6.1 /100 | #229 | Tragic $38,382 |
Demographics Similar to Apache by Median Female Earnings
In terms of median female earnings, the demographic groups most similar to Apache are Cuban ($34,942, a difference of 0.13%), Yaqui ($34,943, a difference of 0.14%), Ute ($34,960, a difference of 0.19%), Pennsylvania German ($34,802, a difference of 0.27%), and Chippewa ($35,003, a difference of 0.31%).
| Demographics | Rating | Rank | Median Female Earnings |
| Sioux | 0.0 /100 | #307 | Tragic $35,063 |
| Immigrants | Bahamas | 0.0 /100 | #308 | Tragic $35,027 |
| Hondurans | 0.0 /100 | #309 | Tragic $35,013 |
| Chippewa | 0.0 /100 | #310 | Tragic $35,003 |
| Ute | 0.0 /100 | #311 | Tragic $34,960 |
| Yaqui | 0.0 /100 | #312 | Tragic $34,943 |
| Cubans | 0.0 /100 | #313 | Tragic $34,942 |
| Apache | 0.0 /100 | #314 | Tragic $34,895 |
| Pennsylvania Germans | 0.0 /100 | #315 | Tragic $34,802 |
| Cherokee | 0.0 /100 | #316 | Tragic $34,742 |
| Potawatomi | 0.0 /100 | #317 | Tragic $34,739 |
| Immigrants | Yemen | 0.0 /100 | #318 | Tragic $34,693 |
| Shoshone | 0.0 /100 | #319 | Tragic $34,677 |
| Immigrants | Honduras | 0.0 /100 | #320 | Tragic $34,647 |
| Hispanics or Latinos | 0.0 /100 | #321 | Tragic $34,421 |