Japanese vs Immigrants from Germany Single Mother Poverty
COMPARE
Japanese
Immigrants from Germany
Single Mother Poverty
Single Mother Poverty Comparison
Japanese
Immigrants from Germany
28.9%
SINGLE MOTHER POVERTY
68.0/ 100
METRIC RATING
160th/ 347
METRIC RANK
29.5%
SINGLE MOTHER POVERTY
30.4/ 100
METRIC RATING
190th/ 347
METRIC RANK
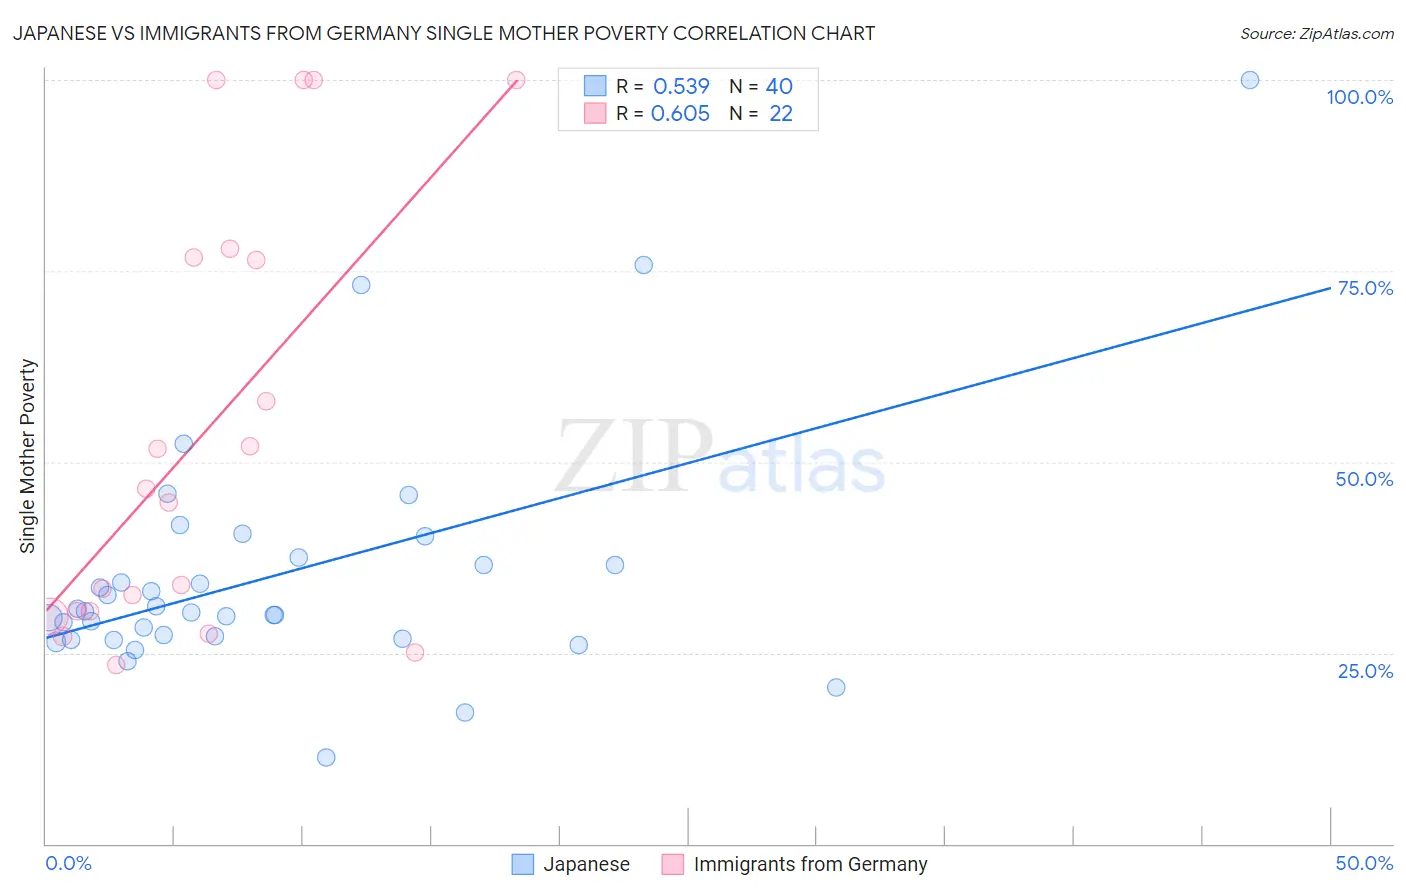
Japanese vs Immigrants from Germany Single Mother Poverty Correlation Chart
The statistical analysis conducted on geographies consisting of 246,409,359 people shows a substantial positive correlation between the proportion of Japanese and poverty level among single mothers in the United States with a correlation coefficient (R) of 0.539 and weighted average of 28.9%. Similarly, the statistical analysis conducted on geographies consisting of 449,496,540 people shows a significant positive correlation between the proportion of Immigrants from Germany and poverty level among single mothers in the United States with a correlation coefficient (R) of 0.605 and weighted average of 29.5%, a difference of 1.9%.
Single Mother Poverty Correlation Summary
| Measurement | Japanese | Immigrants from Germany |
| Minimum | 11.3% | 23.4% |
| Maximum | 100.0% | 100.0% |
| Range | 88.7% | 76.6% |
| Mean | 35.2% | 53.5% |
| Median | 30.4% | 45.6% |
| Interquartile 25% (IQ1) | 27.0% | 30.4% |
| Interquartile 75% (IQ3) | 37.0% | 76.8% |
| Interquartile Range (IQR) | 10.0% | 46.4% |
| Standard Deviation (Sample) | 16.1% | 28.0% |
| Standard Deviation (Population) | 15.9% | 27.3% |
Similar Demographics by Single Mother Poverty
Demographics Similar to Japanese by Single Mother Poverty
In terms of single mother poverty, the demographic groups most similar to Japanese are Czech (28.9%, a difference of 0.020%), Immigrants from Cambodia (28.9%, a difference of 0.080%), Scandinavian (28.9%, a difference of 0.10%), Immigrants from Nigeria (28.9%, a difference of 0.11%), and Immigrants from Kenya (28.9%, a difference of 0.11%).
| Demographics | Rating | Rank | Single Mother Poverty |
| Slovenes | 76.4 /100 | #153 | Good 28.8% |
| Portuguese | 73.2 /100 | #154 | Good 28.8% |
| Ugandans | 71.7 /100 | #155 | Good 28.8% |
| Iraqis | 71.5 /100 | #156 | Good 28.8% |
| Immigrants | Western Europe | 71.1 /100 | #157 | Good 28.9% |
| Immigrants | Hungary | 70.6 /100 | #158 | Good 28.9% |
| Czechs | 68.4 /100 | #159 | Good 28.9% |
| Japanese | 68.0 /100 | #160 | Good 28.9% |
| Immigrants | Cambodia | 66.6 /100 | #161 | Good 28.9% |
| Scandinavians | 66.2 /100 | #162 | Good 28.9% |
| Immigrants | Nigeria | 65.9 /100 | #163 | Good 28.9% |
| Immigrants | Kenya | 65.9 /100 | #164 | Good 28.9% |
| Arabs | 60.7 /100 | #165 | Good 29.0% |
| Inupiat | 60.4 /100 | #166 | Good 29.0% |
| Costa Ricans | 58.4 /100 | #167 | Average 29.0% |
Demographics Similar to Immigrants from Germany by Single Mother Poverty
In terms of single mother poverty, the demographic groups most similar to Immigrants from Germany are Guamanian/Chamorro (29.4%, a difference of 0.070%), Immigrants from Africa (29.4%, a difference of 0.070%), Immigrants from Trinidad and Tobago (29.5%, a difference of 0.070%), Moroccan (29.5%, a difference of 0.10%), and Lebanese (29.4%, a difference of 0.11%).
| Demographics | Rating | Rank | Single Mother Poverty |
| Nepalese | 38.3 /100 | #183 | Fair 29.3% |
| Nigerians | 38.0 /100 | #184 | Fair 29.3% |
| Ghanaians | 36.8 /100 | #185 | Fair 29.4% |
| Yugoslavians | 36.0 /100 | #186 | Fair 29.4% |
| Lebanese | 32.5 /100 | #187 | Fair 29.4% |
| Guamanians/Chamorros | 31.8 /100 | #188 | Fair 29.4% |
| Immigrants | Africa | 31.6 /100 | #189 | Fair 29.4% |
| Immigrants | Germany | 30.4 /100 | #190 | Fair 29.5% |
| Immigrants | Trinidad and Tobago | 29.2 /100 | #191 | Fair 29.5% |
| Moroccans | 28.6 /100 | #192 | Fair 29.5% |
| Basques | 28.3 /100 | #193 | Fair 29.5% |
| Icelanders | 26.1 /100 | #194 | Fair 29.5% |
| Slavs | 24.5 /100 | #195 | Fair 29.6% |
| Spanish American Indians | 23.4 /100 | #196 | Fair 29.6% |
| Immigrants | Jamaica | 22.0 /100 | #197 | Fair 29.6% |