Japanese vs Ugandan Single Mother Poverty
COMPARE
Japanese
Ugandan
Single Mother Poverty
Single Mother Poverty Comparison
Japanese
Ugandans
28.9%
SINGLE MOTHER POVERTY
68.0/ 100
METRIC RATING
160th/ 347
METRIC RANK
28.8%
SINGLE MOTHER POVERTY
71.7/ 100
METRIC RATING
155th/ 347
METRIC RANK
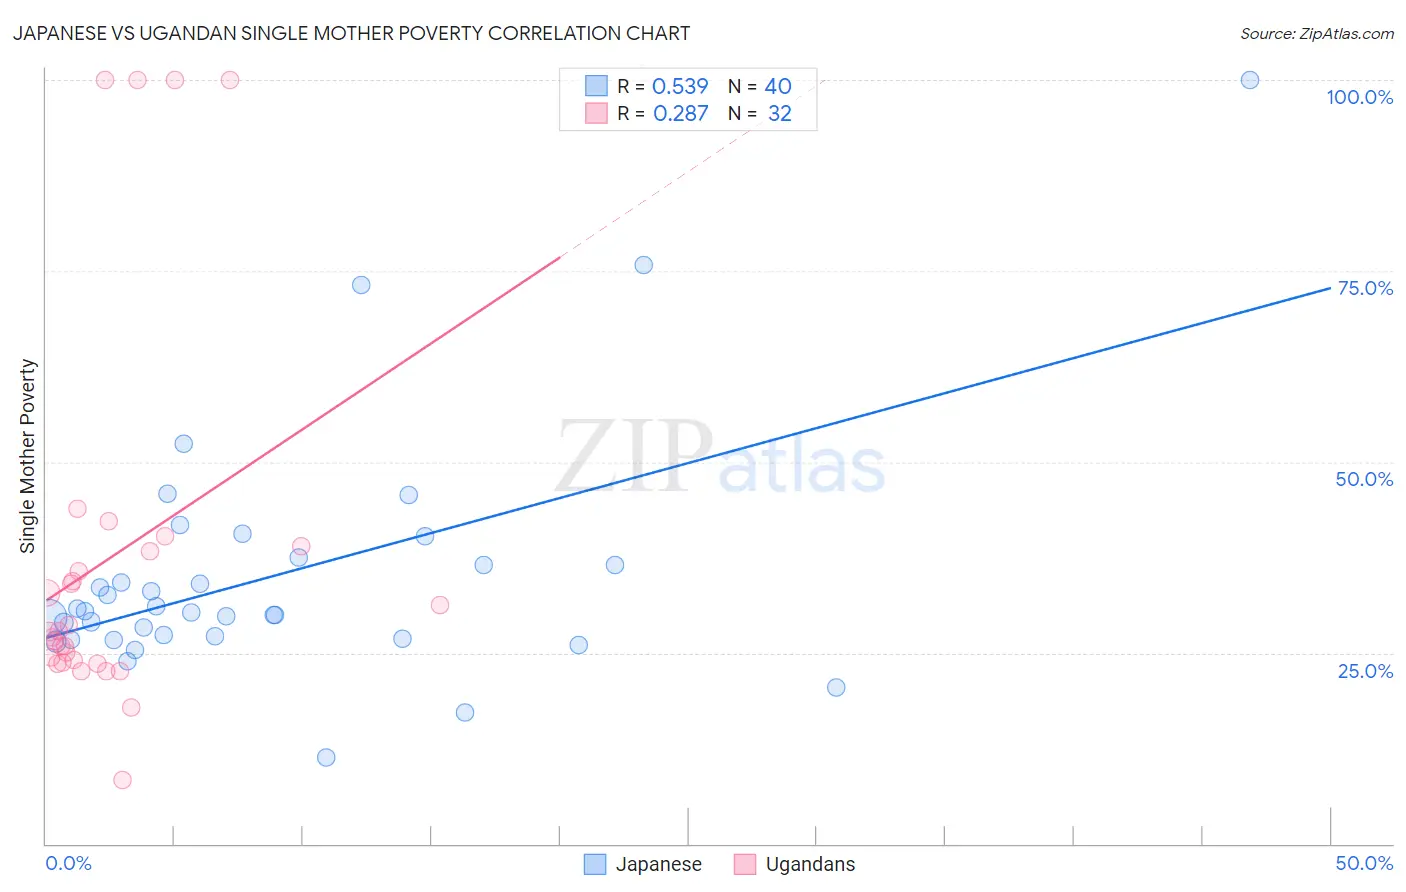
Japanese vs Ugandan Single Mother Poverty Correlation Chart
The statistical analysis conducted on geographies consisting of 246,409,359 people shows a substantial positive correlation between the proportion of Japanese and poverty level among single mothers in the United States with a correlation coefficient (R) of 0.539 and weighted average of 28.9%. Similarly, the statistical analysis conducted on geographies consisting of 93,563,959 people shows a weak positive correlation between the proportion of Ugandans and poverty level among single mothers in the United States with a correlation coefficient (R) of 0.287 and weighted average of 28.8%, a difference of 0.22%.
Single Mother Poverty Correlation Summary
| Measurement | Japanese | Ugandan |
| Minimum | 11.3% | 8.4% |
| Maximum | 100.0% | 100.0% |
| Range | 88.7% | 91.6% |
| Mean | 35.2% | 37.5% |
| Median | 30.4% | 27.8% |
| Interquartile 25% (IQ1) | 27.0% | 23.9% |
| Interquartile 75% (IQ3) | 37.0% | 38.6% |
| Interquartile Range (IQR) | 10.0% | 14.7% |
| Standard Deviation (Sample) | 16.1% | 25.1% |
| Standard Deviation (Population) | 15.9% | 24.7% |
Demographics Similar to Japanese and Ugandans by Single Mother Poverty
In terms of single mother poverty, the demographic groups most similar to Japanese are Czech (28.9%, a difference of 0.020%), Immigrants from Cambodia (28.9%, a difference of 0.080%), Scandinavian (28.9%, a difference of 0.10%), Immigrants from Nigeria (28.9%, a difference of 0.11%), and Immigrants from Kenya (28.9%, a difference of 0.11%). Similarly, the demographic groups most similar to Ugandans are Iraqi (28.8%, a difference of 0.010%), Immigrants from Western Europe (28.9%, a difference of 0.040%), Immigrants from Hungary (28.9%, a difference of 0.070%), Portuguese (28.8%, a difference of 0.090%), and Czech (28.9%, a difference of 0.19%).
| Demographics | Rating | Rank | Single Mother Poverty |
| Immigrants | Lebanon | 85.3 /100 | #147 | Excellent 28.6% |
| Syrians | 85.3 /100 | #148 | Excellent 28.6% |
| Serbians | 85.0 /100 | #149 | Excellent 28.6% |
| Northern Europeans | 81.7 /100 | #150 | Excellent 28.6% |
| Immigrants | Oceania | 79.9 /100 | #151 | Good 28.7% |
| Austrians | 79.0 /100 | #152 | Good 28.7% |
| Slovenes | 76.4 /100 | #153 | Good 28.8% |
| Portuguese | 73.2 /100 | #154 | Good 28.8% |
| Ugandans | 71.7 /100 | #155 | Good 28.8% |
| Iraqis | 71.5 /100 | #156 | Good 28.8% |
| Immigrants | Western Europe | 71.1 /100 | #157 | Good 28.9% |
| Immigrants | Hungary | 70.6 /100 | #158 | Good 28.9% |
| Czechs | 68.4 /100 | #159 | Good 28.9% |
| Japanese | 68.0 /100 | #160 | Good 28.9% |
| Immigrants | Cambodia | 66.6 /100 | #161 | Good 28.9% |
| Scandinavians | 66.2 /100 | #162 | Good 28.9% |
| Immigrants | Nigeria | 65.9 /100 | #163 | Good 28.9% |
| Immigrants | Kenya | 65.9 /100 | #164 | Good 28.9% |
| Arabs | 60.7 /100 | #165 | Good 29.0% |
| Inupiat | 60.4 /100 | #166 | Good 29.0% |
| Costa Ricans | 58.4 /100 | #167 | Average 29.0% |