Jamaican vs Immigrants from Sweden Single Father Households
COMPARE
Jamaican
Immigrants from Sweden
Single Father Households
Single Father Households Comparison
Jamaicans
Immigrants from Sweden
2.3%
SINGLE FATHER HOUSEHOLDS
43.5/ 100
METRIC RATING
181st/ 347
METRIC RANK
2.1%
SINGLE FATHER HOUSEHOLDS
99.8/ 100
METRIC RATING
75th/ 347
METRIC RANK
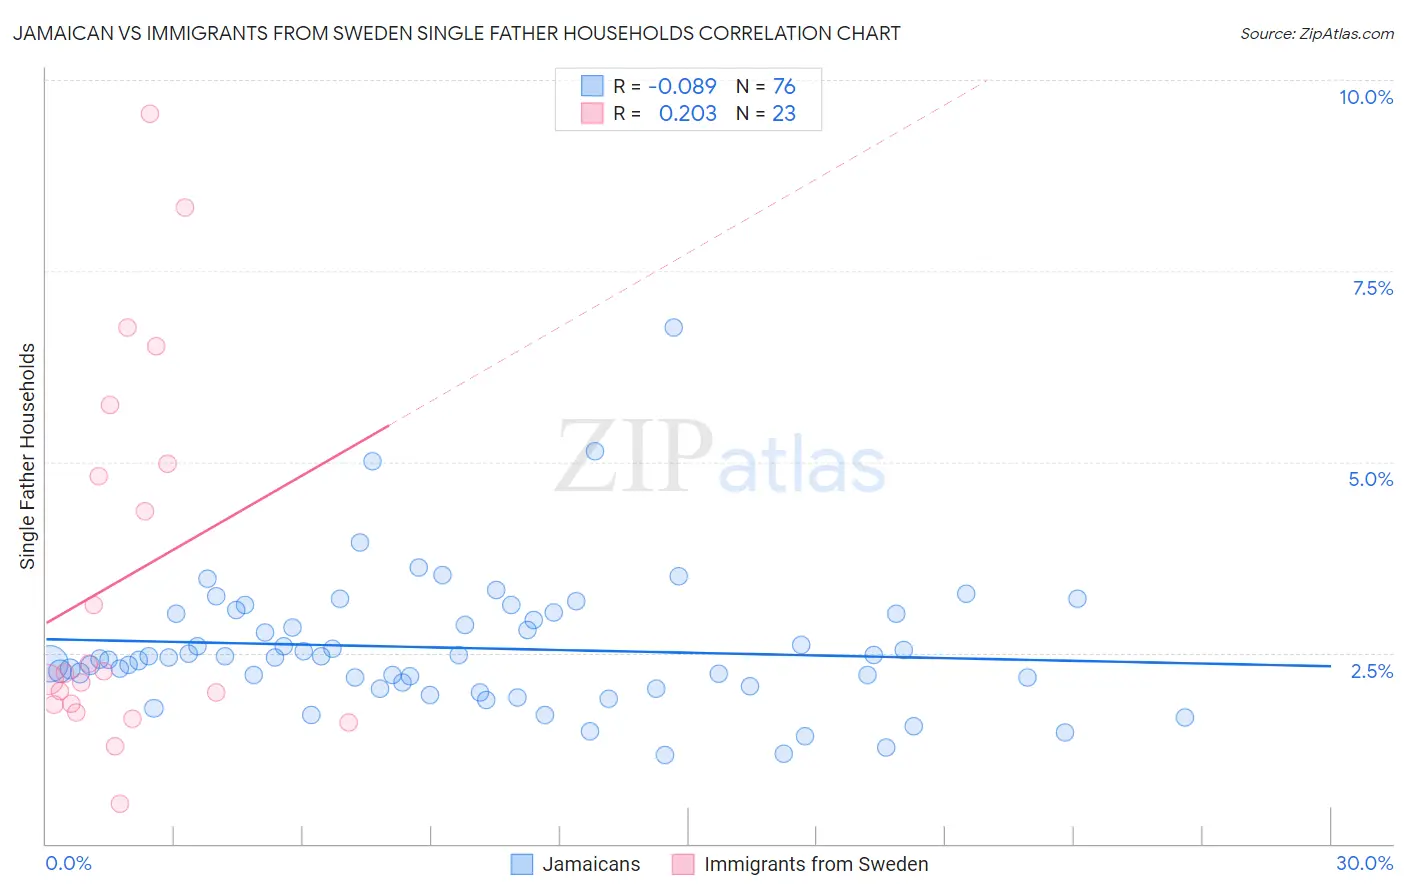
Jamaican vs Immigrants from Sweden Single Father Households Correlation Chart
The statistical analysis conducted on geographies consisting of 365,117,858 people shows a slight negative correlation between the proportion of Jamaicans and percentage of single father households in the United States with a correlation coefficient (R) of -0.089 and weighted average of 2.3%. Similarly, the statistical analysis conducted on geographies consisting of 163,814,795 people shows a weak positive correlation between the proportion of Immigrants from Sweden and percentage of single father households in the United States with a correlation coefficient (R) of 0.203 and weighted average of 2.1%, a difference of 13.1%.
Single Father Households Correlation Summary
| Measurement | Jamaican | Immigrants from Sweden |
| Minimum | 1.2% | 0.53% |
| Maximum | 6.8% | 9.6% |
| Range | 5.6% | 9.0% |
| Mean | 2.6% | 3.5% |
| Median | 2.4% | 2.2% |
| Interquartile 25% (IQ1) | 2.1% | 1.8% |
| Interquartile 75% (IQ3) | 3.0% | 5.0% |
| Interquartile Range (IQR) | 0.92% | 3.1% |
| Standard Deviation (Sample) | 0.88% | 2.4% |
| Standard Deviation (Population) | 0.88% | 2.4% |
Similar Demographics by Single Father Households
Demographics Similar to Jamaicans by Single Father Households
In terms of single father households, the demographic groups most similar to Jamaicans are Belgian (2.3%, a difference of 0.020%), Yugoslavian (2.3%, a difference of 0.030%), Costa Rican (2.3%, a difference of 0.040%), Welsh (2.3%, a difference of 0.040%), and Immigrants from Panama (2.4%, a difference of 0.12%).
| Demographics | Rating | Rank | Single Father Households |
| Afghans | 50.0 /100 | #174 | Average 2.3% |
| Immigrants | Jamaica | 49.1 /100 | #175 | Average 2.3% |
| Danes | 48.2 /100 | #176 | Average 2.3% |
| Colombians | 48.0 /100 | #177 | Average 2.3% |
| Costa Ricans | 44.1 /100 | #178 | Average 2.3% |
| Welsh | 44.0 /100 | #179 | Average 2.3% |
| Yugoslavians | 43.9 /100 | #180 | Average 2.3% |
| Jamaicans | 43.5 /100 | #181 | Average 2.3% |
| Belgians | 43.3 /100 | #182 | Average 2.3% |
| Immigrants | Panama | 41.8 /100 | #183 | Average 2.4% |
| Sri Lankans | 41.8 /100 | #184 | Average 2.4% |
| Nigerians | 41.0 /100 | #185 | Average 2.4% |
| Immigrants | Bosnia and Herzegovina | 40.4 /100 | #186 | Average 2.4% |
| Immigrants | Colombia | 34.0 /100 | #187 | Fair 2.4% |
| Hmong | 33.0 /100 | #188 | Fair 2.4% |
Demographics Similar to Immigrants from Sweden by Single Father Households
In terms of single father households, the demographic groups most similar to Immigrants from Sweden are Immigrants from Scotland (2.1%, a difference of 0.010%), Immigrants from Saudi Arabia (2.1%, a difference of 0.040%), Immigrants from Egypt (2.1%, a difference of 0.28%), Immigrants from Bangladesh (2.1%, a difference of 0.29%), and Estonian (2.1%, a difference of 0.35%).
| Demographics | Rating | Rank | Single Father Households |
| Immigrants | Denmark | 99.8 /100 | #68 | Exceptional 2.1% |
| Immigrants | Romania | 99.8 /100 | #69 | Exceptional 2.1% |
| Egyptians | 99.8 /100 | #70 | Exceptional 2.1% |
| Immigrants | Kuwait | 99.8 /100 | #71 | Exceptional 2.1% |
| Immigrants | Spain | 99.8 /100 | #72 | Exceptional 2.1% |
| Immigrants | Bangladesh | 99.8 /100 | #73 | Exceptional 2.1% |
| Immigrants | Egypt | 99.8 /100 | #74 | Exceptional 2.1% |
| Immigrants | Sweden | 99.8 /100 | #75 | Exceptional 2.1% |
| Immigrants | Scotland | 99.8 /100 | #76 | Exceptional 2.1% |
| Immigrants | Saudi Arabia | 99.8 /100 | #77 | Exceptional 2.1% |
| Estonians | 99.7 /100 | #78 | Exceptional 2.1% |
| Immigrants | Asia | 99.7 /100 | #79 | Exceptional 2.1% |
| Immigrants | South Africa | 99.7 /100 | #80 | Exceptional 2.1% |
| Armenians | 99.7 /100 | #81 | Exceptional 2.1% |
| New Zealanders | 99.7 /100 | #82 | Exceptional 2.1% |