Jamaican vs Immigrants from Sweden Median Male Earnings
COMPARE
Jamaican
Immigrants from Sweden
Median Male Earnings
Median Male Earnings Comparison
Jamaicans
Immigrants from Sweden
$48,632
MEDIAN MALE EARNINGS
0.3/ 100
METRIC RATING
273rd/ 347
METRIC RANK
$65,406
MEDIAN MALE EARNINGS
100.0/ 100
METRIC RATING
21st/ 347
METRIC RANK
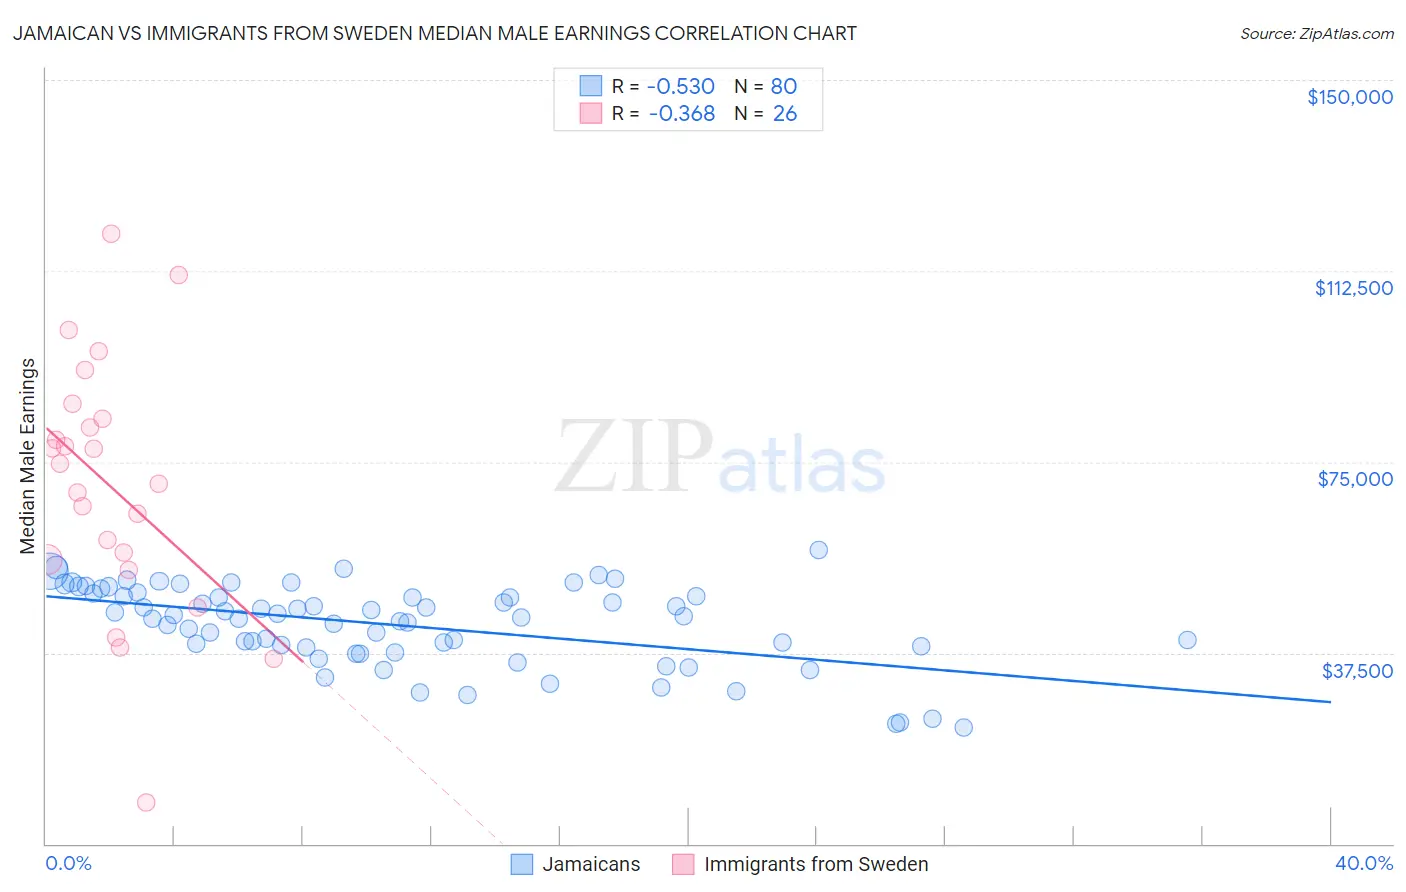
Jamaican vs Immigrants from Sweden Median Male Earnings Correlation Chart
The statistical analysis conducted on geographies consisting of 367,962,773 people shows a substantial negative correlation between the proportion of Jamaicans and median male earnings in the United States with a correlation coefficient (R) of -0.530 and weighted average of $48,632. Similarly, the statistical analysis conducted on geographies consisting of 164,719,286 people shows a mild negative correlation between the proportion of Immigrants from Sweden and median male earnings in the United States with a correlation coefficient (R) of -0.368 and weighted average of $65,406, a difference of 34.5%.
Median Male Earnings Correlation Summary
| Measurement | Jamaican | Immigrants from Sweden |
| Minimum | $22,747 | $8,107 |
| Maximum | $57,769 | $119,732 |
| Range | $35,022 | $111,625 |
| Mean | $42,945 | $70,306 |
| Median | $44,504 | $72,770 |
| Interquartile 25% (IQ1) | $38,662 | $55,777 |
| Interquartile 75% (IQ3) | $48,891 | $83,429 |
| Interquartile Range (IQR) | $10,229 | $27,652 |
| Standard Deviation (Sample) | $7,942 | $24,867 |
| Standard Deviation (Population) | $7,893 | $24,384 |
Similar Demographics by Median Male Earnings
Demographics Similar to Jamaicans by Median Male Earnings
In terms of median male earnings, the demographic groups most similar to Jamaicans are Salvadoran ($48,646, a difference of 0.030%), Cherokee ($48,669, a difference of 0.080%), Colville ($48,516, a difference of 0.24%), Potawatomi ($48,768, a difference of 0.28%), and Immigrants from Somalia ($48,439, a difference of 0.40%).
| Demographics | Rating | Rank | Median Male Earnings |
| Somalis | 0.5 /100 | #266 | Tragic $49,025 |
| Spanish Americans | 0.5 /100 | #267 | Tragic $49,008 |
| Ute | 0.4 /100 | #268 | Tragic $48,899 |
| Tsimshian | 0.4 /100 | #269 | Tragic $48,836 |
| Potawatomi | 0.4 /100 | #270 | Tragic $48,768 |
| Cherokee | 0.3 /100 | #271 | Tragic $48,669 |
| Salvadorans | 0.3 /100 | #272 | Tragic $48,646 |
| Jamaicans | 0.3 /100 | #273 | Tragic $48,632 |
| Colville | 0.3 /100 | #274 | Tragic $48,516 |
| Immigrants | Somalia | 0.3 /100 | #275 | Tragic $48,439 |
| Blackfeet | 0.3 /100 | #276 | Tragic $48,402 |
| Belizeans | 0.2 /100 | #277 | Tragic $48,358 |
| Immigrants | Liberia | 0.2 /100 | #278 | Tragic $48,317 |
| Hmong | 0.2 /100 | #279 | Tragic $48,254 |
| Comanche | 0.2 /100 | #280 | Tragic $48,202 |
Demographics Similar to Immigrants from Sweden by Median Male Earnings
In terms of median male earnings, the demographic groups most similar to Immigrants from Sweden are Immigrants from Japan ($65,518, a difference of 0.17%), Cypriot ($65,549, a difference of 0.22%), Burmese ($65,236, a difference of 0.26%), Immigrants from Korea ($65,079, a difference of 0.50%), and Immigrants from Northern Europe ($64,987, a difference of 0.65%).
| Demographics | Rating | Rank | Median Male Earnings |
| Okinawans | 100.0 /100 | #14 | Exceptional $67,232 |
| Immigrants | Eastern Asia | 100.0 /100 | #15 | Exceptional $66,903 |
| Eastern Europeans | 100.0 /100 | #16 | Exceptional $66,472 |
| Immigrants | Belgium | 100.0 /100 | #17 | Exceptional $66,125 |
| Indians (Asian) | 100.0 /100 | #18 | Exceptional $66,078 |
| Cypriots | 100.0 /100 | #19 | Exceptional $65,549 |
| Immigrants | Japan | 100.0 /100 | #20 | Exceptional $65,518 |
| Immigrants | Sweden | 100.0 /100 | #21 | Exceptional $65,406 |
| Burmese | 100.0 /100 | #22 | Exceptional $65,236 |
| Immigrants | Korea | 100.0 /100 | #23 | Exceptional $65,079 |
| Immigrants | Northern Europe | 100.0 /100 | #24 | Exceptional $64,987 |
| Immigrants | Denmark | 100.0 /100 | #25 | Exceptional $64,625 |
| Turks | 100.0 /100 | #26 | Exceptional $64,253 |
| Immigrants | Switzerland | 100.0 /100 | #27 | Exceptional $63,944 |
| Russians | 100.0 /100 | #28 | Exceptional $63,939 |