Jamaican vs Immigrants from Sweden Divorced or Separated
COMPARE
Jamaican
Immigrants from Sweden
Divorced or Separated
Divorced or Separated Comparison
Jamaicans
Immigrants from Sweden
12.9%
DIVORCED OR SEPARATED
0.0/ 100
METRIC RATING
293rd/ 347
METRIC RANK
11.6%
DIVORCED OR SEPARATED
98.6/ 100
METRIC RATING
99th/ 347
METRIC RANK
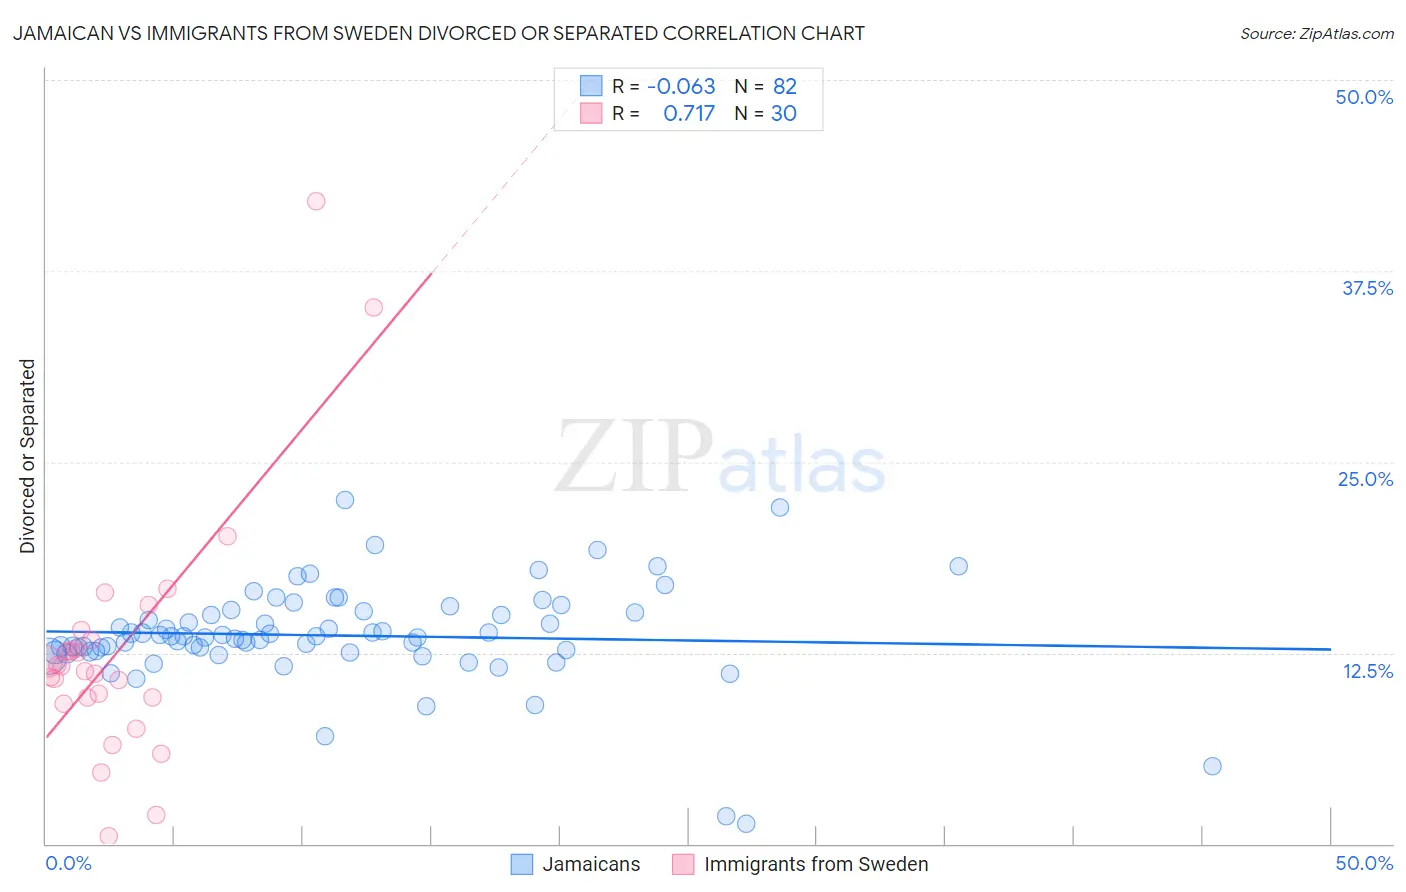
Jamaican vs Immigrants from Sweden Divorced or Separated Correlation Chart
The statistical analysis conducted on geographies consisting of 367,802,354 people shows a slight negative correlation between the proportion of Jamaicans and percentage of population currently divorced or separated in the United States with a correlation coefficient (R) of -0.063 and weighted average of 12.9%. Similarly, the statistical analysis conducted on geographies consisting of 164,719,872 people shows a strong positive correlation between the proportion of Immigrants from Sweden and percentage of population currently divorced or separated in the United States with a correlation coefficient (R) of 0.717 and weighted average of 11.6%, a difference of 11.4%.
Divorced or Separated Correlation Summary
| Measurement | Jamaican | Immigrants from Sweden |
| Minimum | 1.3% | 0.50% |
| Maximum | 22.5% | 42.1% |
| Range | 21.2% | 41.6% |
| Mean | 13.6% | 12.6% |
| Median | 13.5% | 11.5% |
| Interquartile 25% (IQ1) | 12.6% | 9.6% |
| Interquartile 75% (IQ3) | 15.2% | 13.4% |
| Interquartile Range (IQR) | 2.6% | 3.8% |
| Standard Deviation (Sample) | 3.3% | 8.2% |
| Standard Deviation (Population) | 3.3% | 8.1% |
Similar Demographics by Divorced or Separated
Demographics Similar to Jamaicans by Divorced or Separated
In terms of divorced or separated, the demographic groups most similar to Jamaicans are Apache (12.9%, a difference of 0.030%), Celtic (13.0%, a difference of 0.16%), Scotch-Irish (12.9%, a difference of 0.21%), Immigrants from Honduras (12.9%, a difference of 0.27%), and Pima (12.9%, a difference of 0.38%).
| Demographics | Rating | Rank | Divorced or Separated |
| Spanish | 0.1 /100 | #286 | Tragic 12.8% |
| Hondurans | 0.1 /100 | #287 | Tragic 12.8% |
| French Canadians | 0.1 /100 | #288 | Tragic 12.8% |
| Iroquois | 0.0 /100 | #289 | Tragic 12.9% |
| Pima | 0.0 /100 | #290 | Tragic 12.9% |
| Immigrants | Honduras | 0.0 /100 | #291 | Tragic 12.9% |
| Scotch-Irish | 0.0 /100 | #292 | Tragic 12.9% |
| Jamaicans | 0.0 /100 | #293 | Tragic 12.9% |
| Apache | 0.0 /100 | #294 | Tragic 12.9% |
| Celtics | 0.0 /100 | #295 | Tragic 13.0% |
| Nicaraguans | 0.0 /100 | #296 | Tragic 13.0% |
| Natives/Alaskans | 0.0 /100 | #297 | Tragic 13.0% |
| Venezuelans | 0.0 /100 | #298 | Tragic 13.0% |
| Immigrants | Jamaica | 0.0 /100 | #299 | Tragic 13.0% |
| Immigrants | Cabo Verde | 0.0 /100 | #300 | Tragic 13.1% |
Demographics Similar to Immigrants from Sweden by Divorced or Separated
In terms of divorced or separated, the demographic groups most similar to Immigrants from Sweden are Immigrants from Jordan (11.6%, a difference of 0.020%), Immigrants from Northern Europe (11.6%, a difference of 0.030%), Latvian (11.6%, a difference of 0.060%), Immigrants from Guyana (11.6%, a difference of 0.070%), and Immigrants from Ukraine (11.6%, a difference of 0.080%).
| Demographics | Rating | Rank | Divorced or Separated |
| Immigrants | Denmark | 98.9 /100 | #92 | Exceptional 11.6% |
| Arabs | 98.9 /100 | #93 | Exceptional 11.6% |
| Immigrants | Fiji | 98.9 /100 | #94 | Exceptional 11.6% |
| Immigrants | Serbia | 98.8 /100 | #95 | Exceptional 11.6% |
| Immigrants | Ukraine | 98.7 /100 | #96 | Exceptional 11.6% |
| Latvians | 98.7 /100 | #97 | Exceptional 11.6% |
| Immigrants | Jordan | 98.6 /100 | #98 | Exceptional 11.6% |
| Immigrants | Sweden | 98.6 /100 | #99 | Exceptional 11.6% |
| Immigrants | Northern Europe | 98.6 /100 | #100 | Exceptional 11.6% |
| Immigrants | Guyana | 98.5 /100 | #101 | Exceptional 11.6% |
| Immigrants | Croatia | 98.3 /100 | #102 | Exceptional 11.6% |
| Maltese | 98.2 /100 | #103 | Exceptional 11.6% |
| Salvadorans | 98.2 /100 | #104 | Exceptional 11.6% |
| Immigrants | El Salvador | 97.9 /100 | #105 | Exceptional 11.7% |
| Immigrants | Kazakhstan | 97.8 /100 | #106 | Exceptional 11.7% |