Jamaican vs Immigrants from Ireland Householder Income Ages 25 - 44 years
COMPARE
Jamaican
Immigrants from Ireland
Householder Income Ages 25 - 44 years
Householder Income Ages 25 - 44 years Comparison
Jamaicans
Immigrants from Ireland
$83,933
HOUSEHOLDER INCOME AGES 25 - 44 YEARS
0.3/ 100
METRIC RATING
270th/ 347
METRIC RANK
$120,333
HOUSEHOLDER INCOME AGES 25 - 44 YEARS
100.0/ 100
METRIC RATING
7th/ 347
METRIC RANK
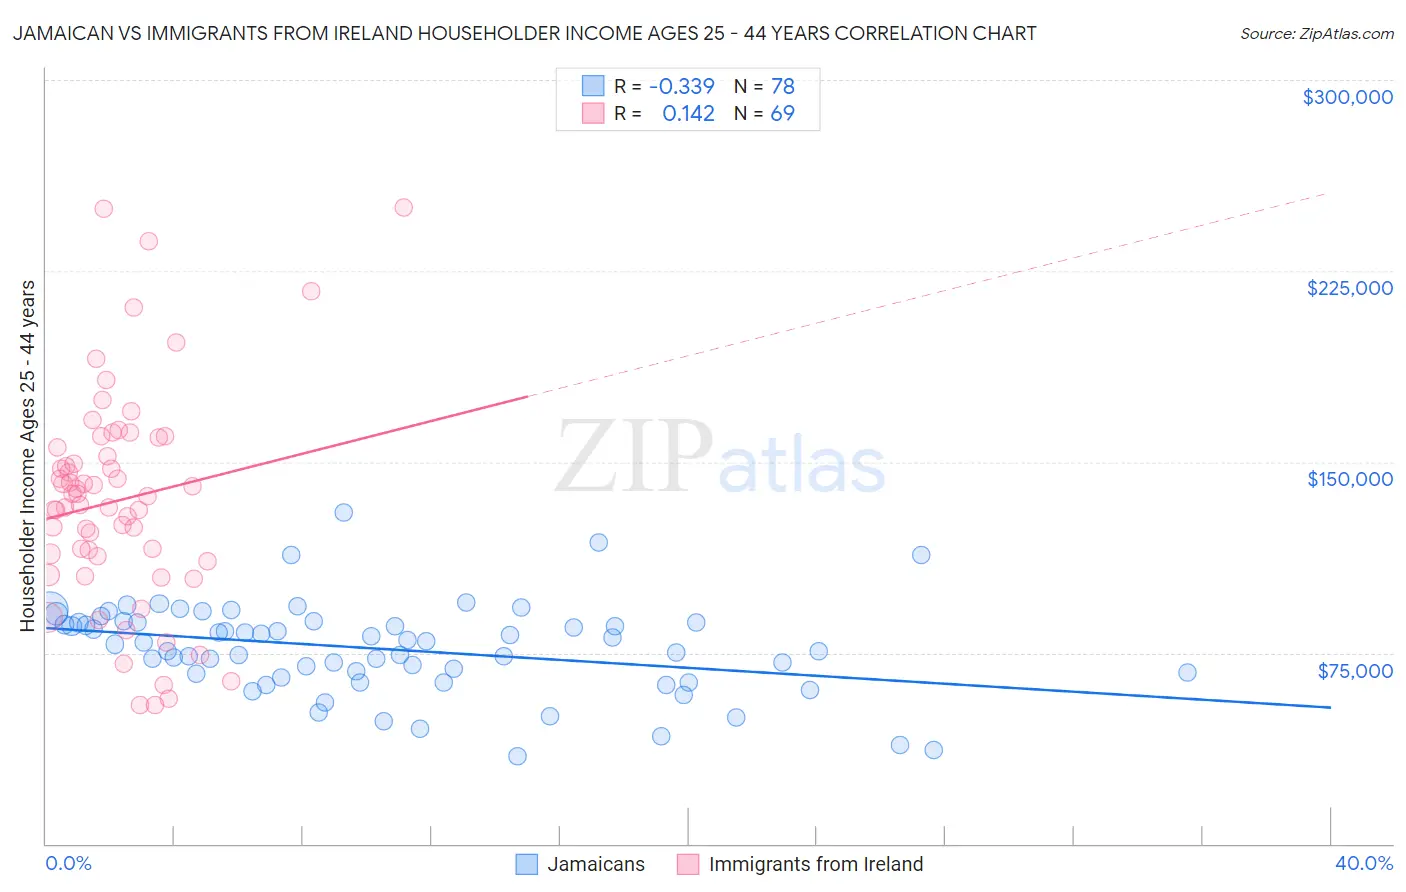
Jamaican vs Immigrants from Ireland Householder Income Ages 25 - 44 years Correlation Chart
The statistical analysis conducted on geographies consisting of 367,030,612 people shows a mild negative correlation between the proportion of Jamaicans and household income with householder between the ages 25 and 44 in the United States with a correlation coefficient (R) of -0.339 and weighted average of $83,933. Similarly, the statistical analysis conducted on geographies consisting of 240,342,740 people shows a poor positive correlation between the proportion of Immigrants from Ireland and household income with householder between the ages 25 and 44 in the United States with a correlation coefficient (R) of 0.142 and weighted average of $120,333, a difference of 43.4%.
Householder Income Ages 25 - 44 years Correlation Summary
| Measurement | Jamaican | Immigrants from Ireland |
| Minimum | $34,529 | $54,479 |
| Maximum | $130,290 | $250,001 |
| Range | $95,761 | $195,522 |
| Mean | $76,521 | $134,959 |
| Median | $78,807 | $136,656 |
| Interquartile 25% (IQ1) | $66,599 | $112,137 |
| Interquartile 75% (IQ3) | $86,908 | $157,677 |
| Interquartile Range (IQR) | $20,309 | $45,540 |
| Standard Deviation (Sample) | $17,827 | $42,676 |
| Standard Deviation (Population) | $17,712 | $42,366 |
Similar Demographics by Householder Income Ages 25 - 44 years
Demographics Similar to Jamaicans by Householder Income Ages 25 - 44 years
In terms of householder income ages 25 - 44 years, the demographic groups most similar to Jamaicans are Spanish American Indian ($84,085, a difference of 0.18%), Somali ($83,752, a difference of 0.22%), Spanish American ($83,722, a difference of 0.25%), Iroquois ($83,682, a difference of 0.30%), and Subsaharan African ($84,235, a difference of 0.36%).
| Demographics | Rating | Rank | Householder Income Ages 25 - 44 years |
| Belizeans | 0.4 /100 | #263 | Tragic $84,534 |
| Osage | 0.4 /100 | #264 | Tragic $84,461 |
| Sudanese | 0.4 /100 | #265 | Tragic $84,401 |
| Immigrants | Cabo Verde | 0.3 /100 | #266 | Tragic $84,304 |
| Hmong | 0.3 /100 | #267 | Tragic $84,258 |
| Sub-Saharan Africans | 0.3 /100 | #268 | Tragic $84,235 |
| Spanish American Indians | 0.3 /100 | #269 | Tragic $84,085 |
| Jamaicans | 0.3 /100 | #270 | Tragic $83,933 |
| Somalis | 0.2 /100 | #271 | Tragic $83,752 |
| Spanish Americans | 0.2 /100 | #272 | Tragic $83,722 |
| Iroquois | 0.2 /100 | #273 | Tragic $83,682 |
| Marshallese | 0.2 /100 | #274 | Tragic $83,575 |
| Immigrants | Jamaica | 0.2 /100 | #275 | Tragic $83,298 |
| Immigrants | Belize | 0.2 /100 | #276 | Tragic $83,141 |
| Paiute | 0.2 /100 | #277 | Tragic $82,984 |
Demographics Similar to Immigrants from Ireland by Householder Income Ages 25 - 44 years
In terms of householder income ages 25 - 44 years, the demographic groups most similar to Immigrants from Ireland are Iranian ($120,292, a difference of 0.030%), Immigrants from China ($119,756, a difference of 0.48%), Indian (Asian) ($119,496, a difference of 0.70%), Okinawan ($119,349, a difference of 0.82%), and Immigrants from Iran ($119,204, a difference of 0.95%).
| Demographics | Rating | Rank | Householder Income Ages 25 - 44 years |
| Immigrants | Taiwan | 100.0 /100 | #1 | Exceptional $129,122 |
| Filipinos | 100.0 /100 | #2 | Exceptional $128,723 |
| Immigrants | Hong Kong | 100.0 /100 | #3 | Exceptional $128,140 |
| Immigrants | Singapore | 100.0 /100 | #4 | Exceptional $124,429 |
| Immigrants | India | 100.0 /100 | #5 | Exceptional $124,238 |
| Thais | 100.0 /100 | #6 | Exceptional $121,778 |
| Immigrants | Ireland | 100.0 /100 | #7 | Exceptional $120,333 |
| Iranians | 100.0 /100 | #8 | Exceptional $120,292 |
| Immigrants | China | 100.0 /100 | #9 | Exceptional $119,756 |
| Indians (Asian) | 100.0 /100 | #10 | Exceptional $119,496 |
| Okinawans | 100.0 /100 | #11 | Exceptional $119,349 |
| Immigrants | Iran | 100.0 /100 | #12 | Exceptional $119,204 |
| Immigrants | Eastern Asia | 100.0 /100 | #13 | Exceptional $118,056 |
| Immigrants | Israel | 100.0 /100 | #14 | Exceptional $117,219 |
| Immigrants | South Central Asia | 100.0 /100 | #15 | Exceptional $116,626 |