Jamaican vs Immigrants from Hungary Associate's Degree
COMPARE
Jamaican
Immigrants from Hungary
Associate's Degree
Associate's Degree Comparison
Jamaicans
Immigrants from Hungary
42.1%
ASSOCIATE'S DEGREE
0.7/ 100
METRIC RATING
249th/ 347
METRIC RANK
50.2%
ASSOCIATE'S DEGREE
98.9/ 100
METRIC RATING
84th/ 347
METRIC RANK
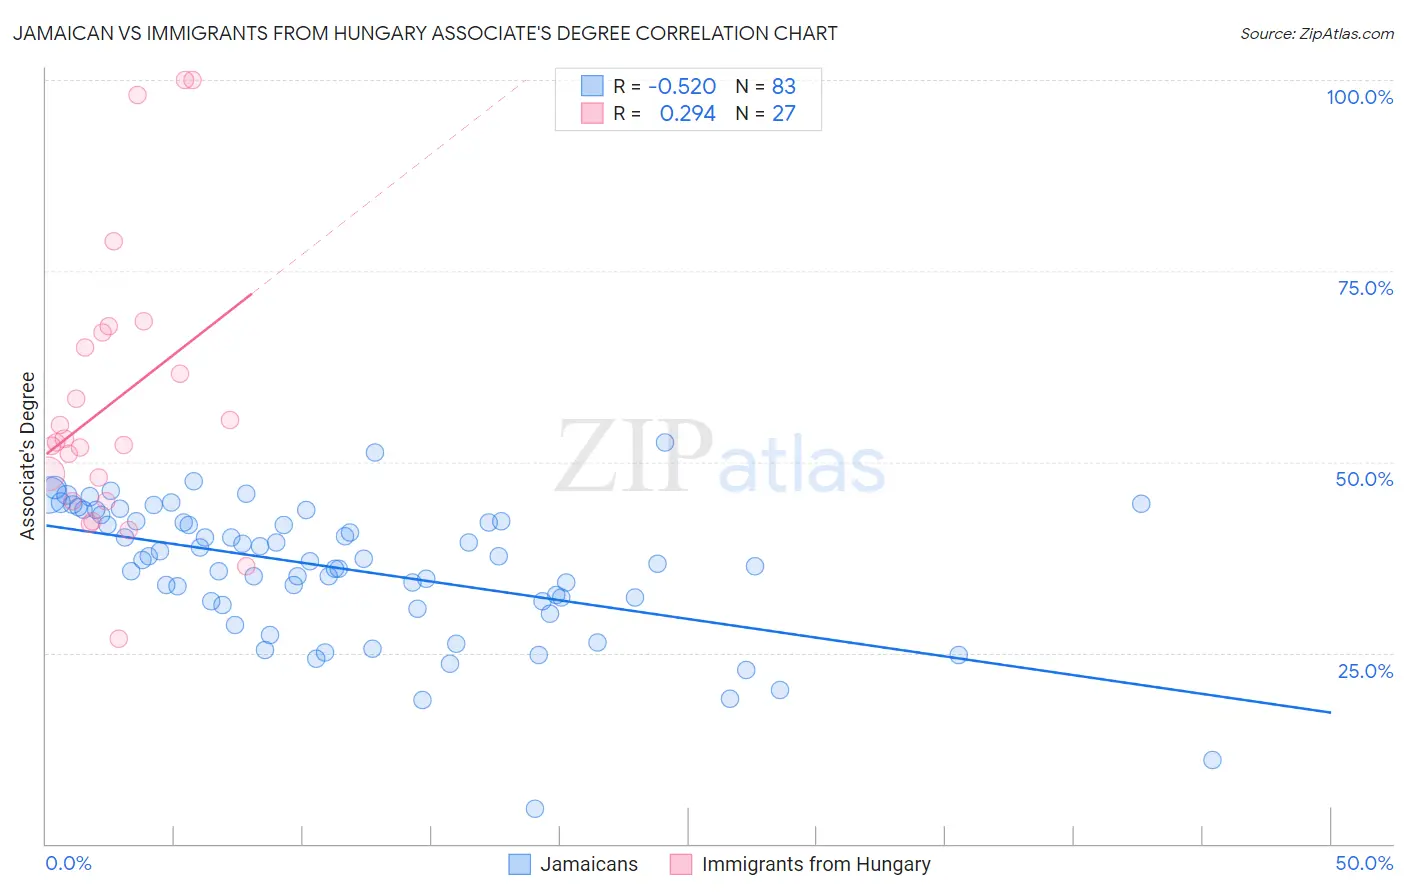
Jamaican vs Immigrants from Hungary Associate's Degree Correlation Chart
The statistical analysis conducted on geographies consisting of 368,030,405 people shows a substantial negative correlation between the proportion of Jamaicans and percentage of population with at least associate's degree education in the United States with a correlation coefficient (R) of -0.520 and weighted average of 42.1%. Similarly, the statistical analysis conducted on geographies consisting of 195,705,079 people shows a weak positive correlation between the proportion of Immigrants from Hungary and percentage of population with at least associate's degree education in the United States with a correlation coefficient (R) of 0.294 and weighted average of 50.2%, a difference of 19.3%.
Associate's Degree Correlation Summary
| Measurement | Jamaican | Immigrants from Hungary |
| Minimum | 4.5% | 26.9% |
| Maximum | 52.5% | 100.0% |
| Range | 48.0% | 73.1% |
| Mean | 36.0% | 57.9% |
| Median | 37.1% | 52.5% |
| Interquartile 25% (IQ1) | 31.8% | 44.9% |
| Interquartile 75% (IQ3) | 42.2% | 66.9% |
| Interquartile Range (IQR) | 10.4% | 22.1% |
| Standard Deviation (Sample) | 8.8% | 18.5% |
| Standard Deviation (Population) | 8.8% | 18.2% |
Similar Demographics by Associate's Degree
Demographics Similar to Jamaicans by Associate's Degree
In terms of associate's degree, the demographic groups most similar to Jamaicans are U.S. Virgin Islander (42.1%, a difference of 0.010%), Immigrants from Bahamas (42.1%, a difference of 0.030%), Immigrants from Ecuador (42.2%, a difference of 0.14%), Immigrants from Fiji (42.2%, a difference of 0.23%), and Delaware (42.3%, a difference of 0.32%).
| Demographics | Rating | Rank | Associate's Degree |
| Immigrants | West Indies | 1.0 /100 | #242 | Tragic 42.4% |
| Guyanese | 1.0 /100 | #243 | Tragic 42.3% |
| Immigrants | Liberia | 0.9 /100 | #244 | Tragic 42.3% |
| Immigrants | Cambodia | 0.9 /100 | #245 | Tragic 42.3% |
| Delaware | 0.9 /100 | #246 | Tragic 42.3% |
| Immigrants | Fiji | 0.8 /100 | #247 | Tragic 42.2% |
| Immigrants | Ecuador | 0.8 /100 | #248 | Tragic 42.2% |
| Jamaicans | 0.7 /100 | #249 | Tragic 42.1% |
| U.S. Virgin Islanders | 0.7 /100 | #250 | Tragic 42.1% |
| Immigrants | Bahamas | 0.7 /100 | #251 | Tragic 42.1% |
| French American Indians | 0.6 /100 | #252 | Tragic 42.0% |
| Indonesians | 0.6 /100 | #253 | Tragic 41.9% |
| Cubans | 0.6 /100 | #254 | Tragic 41.9% |
| Immigrants | Guyana | 0.5 /100 | #255 | Tragic 41.8% |
| Immigrants | Congo | 0.5 /100 | #256 | Tragic 41.8% |
Demographics Similar to Immigrants from Hungary by Associate's Degree
In terms of associate's degree, the demographic groups most similar to Immigrants from Hungary are Immigrants from Uzbekistan (50.3%, a difference of 0.020%), Immigrants from Egypt (50.2%, a difference of 0.050%), Greek (50.3%, a difference of 0.060%), Immigrants from Croatia (50.2%, a difference of 0.060%), and Immigrants from Moldova (50.2%, a difference of 0.17%).
| Demographics | Rating | Rank | Associate's Degree |
| Immigrants | Lebanon | 99.1 /100 | #77 | Exceptional 50.5% |
| Immigrants | Eastern Europe | 99.1 /100 | #78 | Exceptional 50.5% |
| Ethiopians | 99.1 /100 | #79 | Exceptional 50.4% |
| Armenians | 99.1 /100 | #80 | Exceptional 50.4% |
| Maltese | 99.1 /100 | #81 | Exceptional 50.4% |
| Greeks | 98.9 /100 | #82 | Exceptional 50.3% |
| Immigrants | Uzbekistan | 98.9 /100 | #83 | Exceptional 50.3% |
| Immigrants | Hungary | 98.9 /100 | #84 | Exceptional 50.2% |
| Immigrants | Egypt | 98.9 /100 | #85 | Exceptional 50.2% |
| Immigrants | Croatia | 98.9 /100 | #86 | Exceptional 50.2% |
| Immigrants | Moldova | 98.8 /100 | #87 | Exceptional 50.2% |
| Immigrants | Canada | 98.7 /100 | #88 | Exceptional 50.1% |
| Immigrants | Western Europe | 98.7 /100 | #89 | Exceptional 50.1% |
| Immigrants | Ethiopia | 98.7 /100 | #90 | Exceptional 50.1% |
| Immigrants | Western Asia | 98.7 /100 | #91 | Exceptional 50.1% |