Israeli vs Immigrants from Denmark Single Female Poverty
COMPARE
Israeli
Immigrants from Denmark
Single Female Poverty
Single Female Poverty Comparison
Israelis
Immigrants from Denmark
19.9%
SINGLE FEMALE POVERTY
96.9/ 100
METRIC RATING
105th/ 347
METRIC RANK
20.5%
SINGLE FEMALE POVERTY
80.5/ 100
METRIC RATING
150th/ 347
METRIC RANK
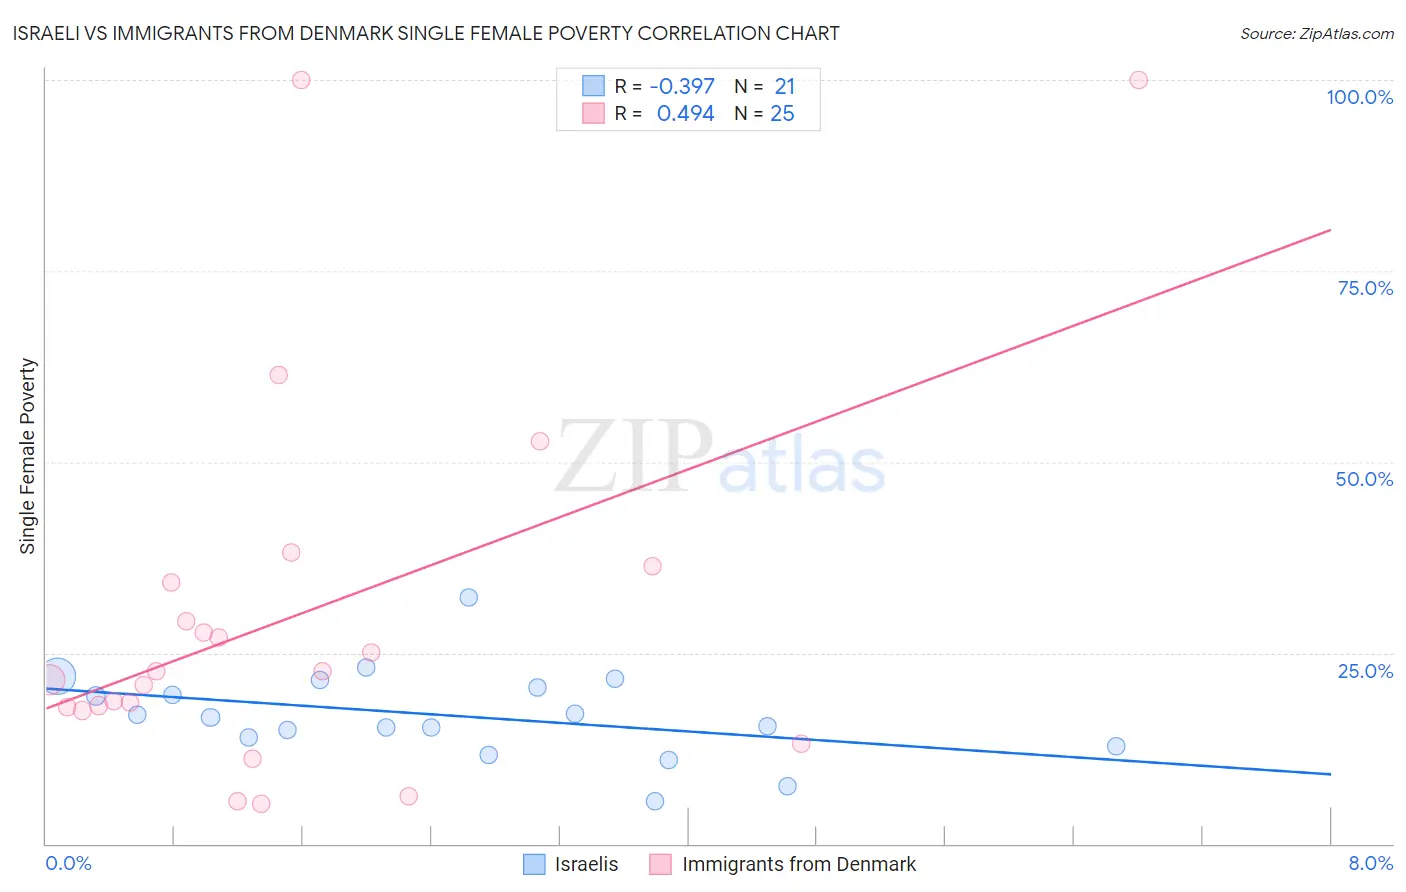
Israeli vs Immigrants from Denmark Single Female Poverty Correlation Chart
The statistical analysis conducted on geographies consisting of 208,686,807 people shows a mild negative correlation between the proportion of Israelis and poverty level among single females in the United States with a correlation coefficient (R) of -0.397 and weighted average of 19.9%. Similarly, the statistical analysis conducted on geographies consisting of 135,190,305 people shows a moderate positive correlation between the proportion of Immigrants from Denmark and poverty level among single females in the United States with a correlation coefficient (R) of 0.494 and weighted average of 20.5%, a difference of 3.3%.
Single Female Poverty Correlation Summary
| Measurement | Israeli | Immigrants from Denmark |
| Minimum | 5.6% | 5.3% |
| Maximum | 32.2% | 100.0% |
| Range | 26.6% | 94.7% |
| Mean | 16.8% | 30.0% |
| Median | 16.5% | 22.5% |
| Interquartile 25% (IQ1) | 13.4% | 17.7% |
| Interquartile 75% (IQ3) | 21.0% | 35.3% |
| Interquartile Range (IQR) | 7.6% | 17.6% |
| Standard Deviation (Sample) | 5.8% | 24.9% |
| Standard Deviation (Population) | 5.7% | 24.4% |
Similar Demographics by Single Female Poverty
Demographics Similar to Israelis by Single Female Poverty
In terms of single female poverty, the demographic groups most similar to Israelis are Chilean (19.9%, a difference of 0.010%), Ethiopian (19.9%, a difference of 0.090%), Immigrants from Syria (19.9%, a difference of 0.11%), Immigrants from Southern Europe (19.9%, a difference of 0.13%), and Native Hawaiian (19.9%, a difference of 0.16%).
| Demographics | Rating | Rank | Single Female Poverty |
| Immigrants | France | 97.9 /100 | #98 | Exceptional 19.7% |
| Sierra Leoneans | 97.9 /100 | #99 | Exceptional 19.7% |
| Ukrainians | 97.6 /100 | #100 | Exceptional 19.8% |
| Immigrants | Belgium | 97.3 /100 | #101 | Exceptional 19.8% |
| Immigrants | Cameroon | 97.3 /100 | #102 | Exceptional 19.8% |
| Immigrants | Southern Europe | 97.1 /100 | #103 | Exceptional 19.9% |
| Chileans | 96.9 /100 | #104 | Exceptional 19.9% |
| Israelis | 96.9 /100 | #105 | Exceptional 19.9% |
| Ethiopians | 96.7 /100 | #106 | Exceptional 19.9% |
| Immigrants | Syria | 96.7 /100 | #107 | Exceptional 19.9% |
| Native Hawaiians | 96.6 /100 | #108 | Exceptional 19.9% |
| Colombians | 96.6 /100 | #109 | Exceptional 19.9% |
| Immigrants | Western Asia | 96.5 /100 | #110 | Exceptional 19.9% |
| Carpatho Rusyns | 96.1 /100 | #111 | Exceptional 20.0% |
| Immigrants | Netherlands | 96.0 /100 | #112 | Exceptional 20.0% |
Demographics Similar to Immigrants from Denmark by Single Female Poverty
In terms of single female poverty, the demographic groups most similar to Immigrants from Denmark are Puget Sound Salish (20.6%, a difference of 0.090%), Portuguese (20.5%, a difference of 0.10%), Immigrants from Uruguay (20.6%, a difference of 0.28%), Swedish (20.6%, a difference of 0.33%), and Immigrants from Western Europe (20.6%, a difference of 0.36%).
| Demographics | Rating | Rank | Single Female Poverty |
| Australians | 88.4 /100 | #143 | Excellent 20.3% |
| Immigrants | Uzbekistan | 88.3 /100 | #144 | Excellent 20.3% |
| Austrians | 85.8 /100 | #145 | Excellent 20.4% |
| Venezuelans | 85.5 /100 | #146 | Excellent 20.4% |
| South Africans | 85.3 /100 | #147 | Excellent 20.4% |
| Luxembourgers | 84.9 /100 | #148 | Excellent 20.4% |
| Portuguese | 81.5 /100 | #149 | Excellent 20.5% |
| Immigrants | Denmark | 80.5 /100 | #150 | Excellent 20.5% |
| Puget Sound Salish | 79.6 /100 | #151 | Good 20.6% |
| Immigrants | Uruguay | 77.7 /100 | #152 | Good 20.6% |
| Swedes | 77.1 /100 | #153 | Good 20.6% |
| Immigrants | Western Europe | 76.7 /100 | #154 | Good 20.6% |
| Samoans | 76.0 /100 | #155 | Good 20.6% |
| South American Indians | 75.7 /100 | #156 | Good 20.6% |
| Immigrants | Oceania | 74.3 /100 | #157 | Good 20.7% |