Israeli vs Indian (Asian) Single Female Poverty
COMPARE
Israeli
Indian (Asian)
Single Female Poverty
Single Female Poverty Comparison
Israelis
Indians (Asian)
19.9%
SINGLE FEMALE POVERTY
96.9/ 100
METRIC RATING
105th/ 347
METRIC RANK
17.9%
SINGLE FEMALE POVERTY
100.0/ 100
METRIC RATING
15th/ 347
METRIC RANK
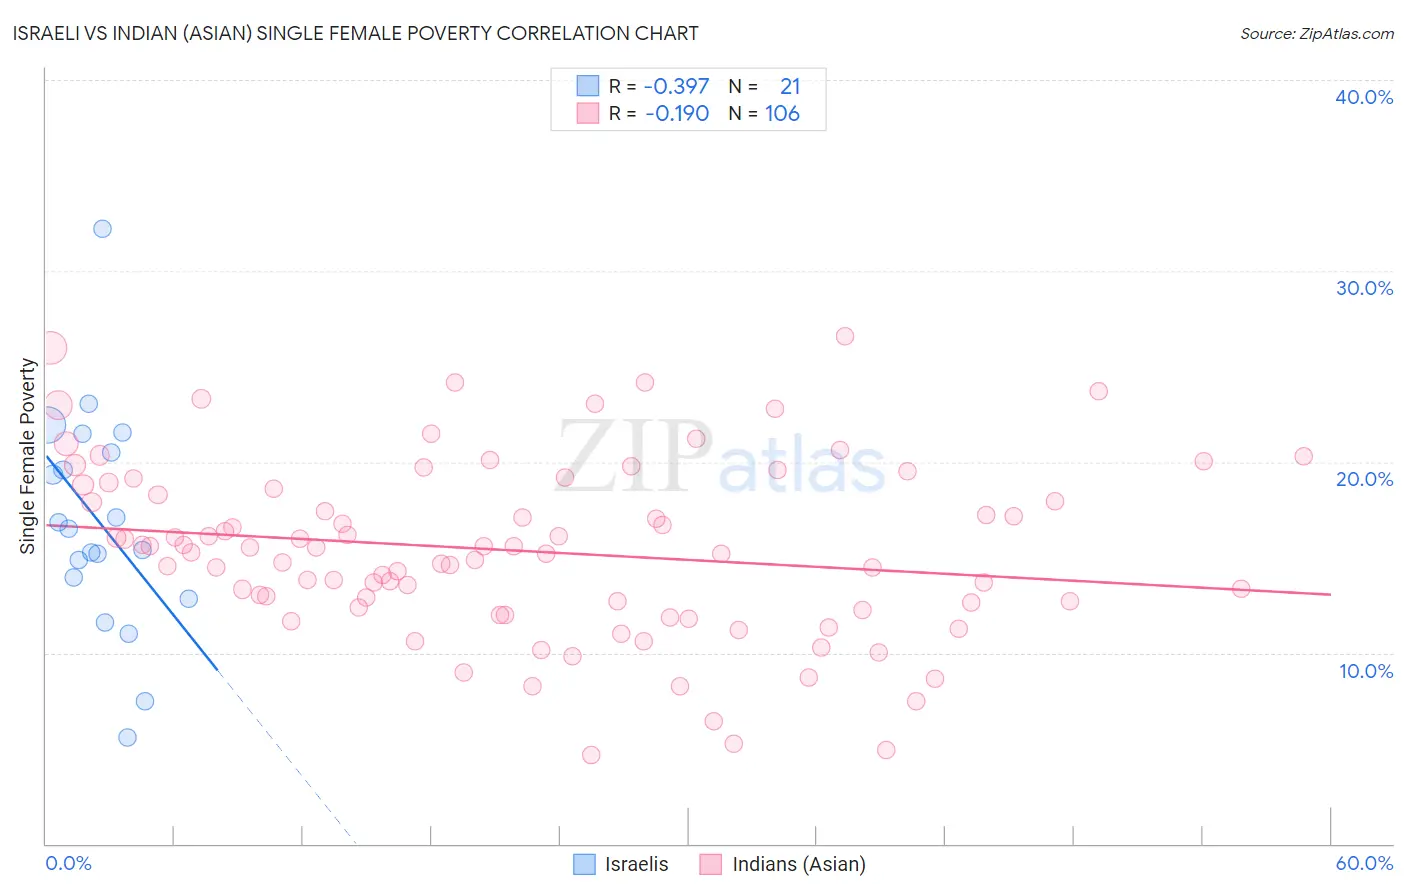
Israeli vs Indian (Asian) Single Female Poverty Correlation Chart
The statistical analysis conducted on geographies consisting of 208,686,807 people shows a mild negative correlation between the proportion of Israelis and poverty level among single females in the United States with a correlation coefficient (R) of -0.397 and weighted average of 19.9%. Similarly, the statistical analysis conducted on geographies consisting of 483,253,971 people shows a poor negative correlation between the proportion of Indians (Asian) and poverty level among single females in the United States with a correlation coefficient (R) of -0.190 and weighted average of 17.9%, a difference of 10.8%.
Single Female Poverty Correlation Summary
| Measurement | Israeli | Indian (Asian) |
| Minimum | 5.6% | 4.6% |
| Maximum | 32.2% | 26.6% |
| Range | 26.6% | 21.9% |
| Mean | 16.8% | 15.3% |
| Median | 16.5% | 15.4% |
| Interquartile 25% (IQ1) | 13.4% | 12.4% |
| Interquartile 75% (IQ3) | 21.0% | 18.6% |
| Interquartile Range (IQR) | 7.6% | 6.2% |
| Standard Deviation (Sample) | 5.8% | 4.6% |
| Standard Deviation (Population) | 5.7% | 4.6% |
Similar Demographics by Single Female Poverty
Demographics Similar to Israelis by Single Female Poverty
In terms of single female poverty, the demographic groups most similar to Israelis are Chilean (19.9%, a difference of 0.010%), Ethiopian (19.9%, a difference of 0.090%), Immigrants from Syria (19.9%, a difference of 0.11%), Immigrants from Southern Europe (19.9%, a difference of 0.13%), and Native Hawaiian (19.9%, a difference of 0.16%).
| Demographics | Rating | Rank | Single Female Poverty |
| Immigrants | France | 97.9 /100 | #98 | Exceptional 19.7% |
| Sierra Leoneans | 97.9 /100 | #99 | Exceptional 19.7% |
| Ukrainians | 97.6 /100 | #100 | Exceptional 19.8% |
| Immigrants | Belgium | 97.3 /100 | #101 | Exceptional 19.8% |
| Immigrants | Cameroon | 97.3 /100 | #102 | Exceptional 19.8% |
| Immigrants | Southern Europe | 97.1 /100 | #103 | Exceptional 19.9% |
| Chileans | 96.9 /100 | #104 | Exceptional 19.9% |
| Israelis | 96.9 /100 | #105 | Exceptional 19.9% |
| Ethiopians | 96.7 /100 | #106 | Exceptional 19.9% |
| Immigrants | Syria | 96.7 /100 | #107 | Exceptional 19.9% |
| Native Hawaiians | 96.6 /100 | #108 | Exceptional 19.9% |
| Colombians | 96.6 /100 | #109 | Exceptional 19.9% |
| Immigrants | Western Asia | 96.5 /100 | #110 | Exceptional 19.9% |
| Carpatho Rusyns | 96.1 /100 | #111 | Exceptional 20.0% |
| Immigrants | Netherlands | 96.0 /100 | #112 | Exceptional 20.0% |
Demographics Similar to Indians (Asian) by Single Female Poverty
In terms of single female poverty, the demographic groups most similar to Indians (Asian) are Bolivian (17.9%, a difference of 0.15%), Iranian (18.0%, a difference of 0.16%), Immigrants from Bolivia (17.8%, a difference of 0.59%), Immigrants from Korea (18.1%, a difference of 0.76%), and Immigrants from South Central Asia (17.8%, a difference of 0.85%).
| Demographics | Rating | Rank | Single Female Poverty |
| Immigrants | Iran | 100.0 /100 | #8 | Exceptional 17.5% |
| Bhutanese | 100.0 /100 | #9 | Exceptional 17.7% |
| Immigrants | Ireland | 100.0 /100 | #10 | Exceptional 17.8% |
| Immigrants | Lithuania | 100.0 /100 | #11 | Exceptional 17.8% |
| Immigrants | South Central Asia | 100.0 /100 | #12 | Exceptional 17.8% |
| Immigrants | Bolivia | 100.0 /100 | #13 | Exceptional 17.8% |
| Bolivians | 100.0 /100 | #14 | Exceptional 17.9% |
| Indians (Asian) | 100.0 /100 | #15 | Exceptional 17.9% |
| Iranians | 100.0 /100 | #16 | Exceptional 18.0% |
| Immigrants | Korea | 100.0 /100 | #17 | Exceptional 18.1% |
| Immigrants | Eastern Asia | 100.0 /100 | #18 | Exceptional 18.1% |
| Immigrants | China | 100.0 /100 | #19 | Exceptional 18.1% |
| Immigrants | Greece | 100.0 /100 | #20 | Exceptional 18.3% |
| Maltese | 100.0 /100 | #21 | Exceptional 18.3% |
| Burmese | 100.0 /100 | #22 | Exceptional 18.3% |