Israeli vs Somali Single Female Poverty
COMPARE
Israeli
Somali
Single Female Poverty
Single Female Poverty Comparison
Israelis
Somalis
19.9%
SINGLE FEMALE POVERTY
96.9/ 100
METRIC RATING
105th/ 347
METRIC RANK
25.2%
SINGLE FEMALE POVERTY
0.0/ 100
METRIC RATING
303rd/ 347
METRIC RANK
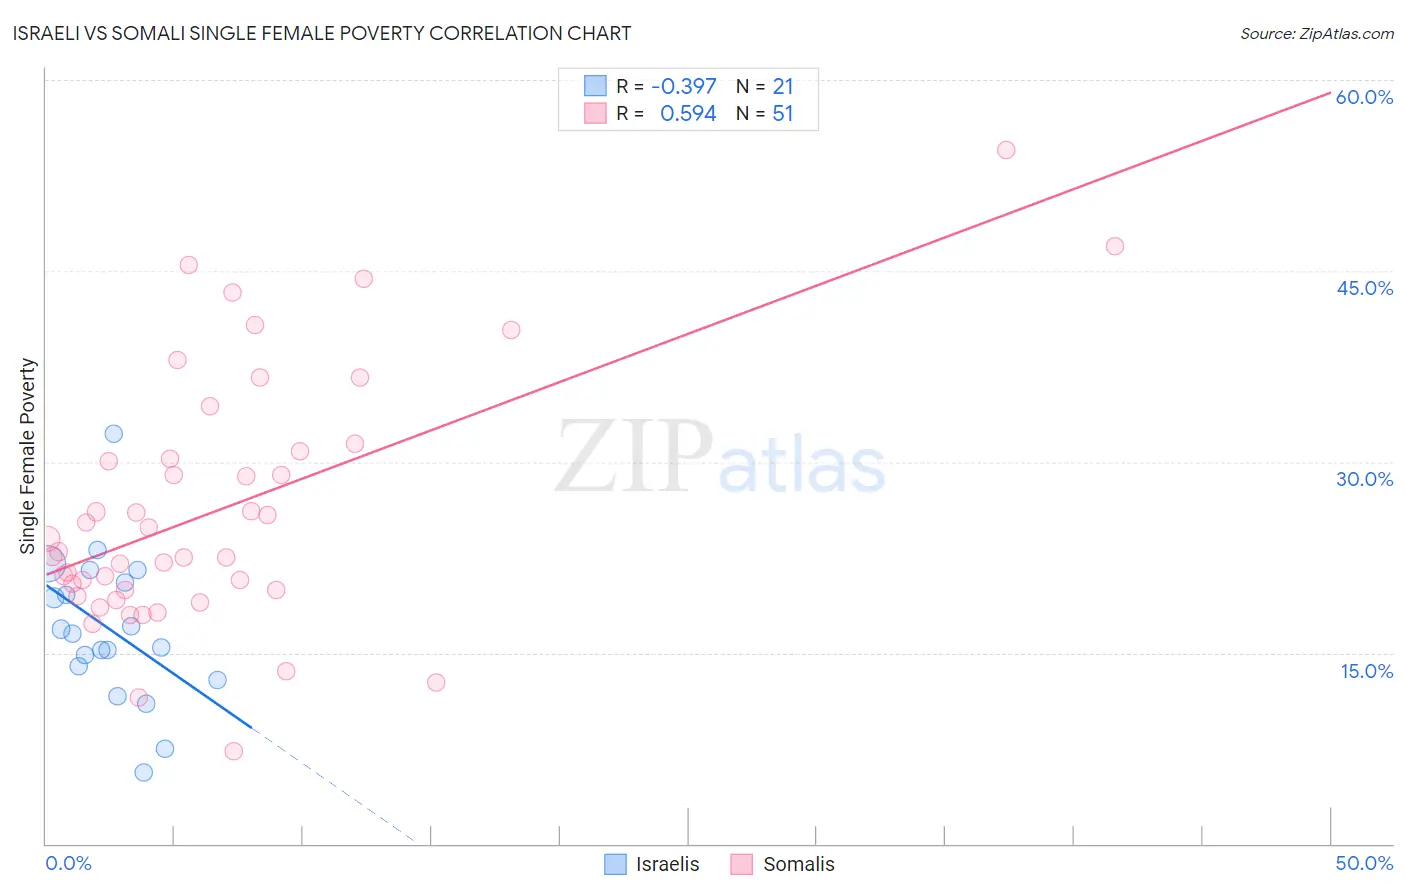
Israeli vs Somali Single Female Poverty Correlation Chart
The statistical analysis conducted on geographies consisting of 208,686,807 people shows a mild negative correlation between the proportion of Israelis and poverty level among single females in the United States with a correlation coefficient (R) of -0.397 and weighted average of 19.9%. Similarly, the statistical analysis conducted on geographies consisting of 99,025,014 people shows a substantial positive correlation between the proportion of Somalis and poverty level among single females in the United States with a correlation coefficient (R) of 0.594 and weighted average of 25.2%, a difference of 26.8%.
Single Female Poverty Correlation Summary
| Measurement | Israeli | Somali |
| Minimum | 5.6% | 7.2% |
| Maximum | 32.2% | 54.5% |
| Range | 26.6% | 47.2% |
| Mean | 16.8% | 26.3% |
| Median | 16.5% | 23.0% |
| Interquartile 25% (IQ1) | 13.4% | 19.9% |
| Interquartile 75% (IQ3) | 21.0% | 30.8% |
| Interquartile Range (IQR) | 7.6% | 10.9% |
| Standard Deviation (Sample) | 5.8% | 9.9% |
| Standard Deviation (Population) | 5.7% | 9.8% |
Similar Demographics by Single Female Poverty
Demographics Similar to Israelis by Single Female Poverty
In terms of single female poverty, the demographic groups most similar to Israelis are Chilean (19.9%, a difference of 0.010%), Ethiopian (19.9%, a difference of 0.090%), Immigrants from Syria (19.9%, a difference of 0.11%), Immigrants from Southern Europe (19.9%, a difference of 0.13%), and Native Hawaiian (19.9%, a difference of 0.16%).
| Demographics | Rating | Rank | Single Female Poverty |
| Immigrants | France | 97.9 /100 | #98 | Exceptional 19.7% |
| Sierra Leoneans | 97.9 /100 | #99 | Exceptional 19.7% |
| Ukrainians | 97.6 /100 | #100 | Exceptional 19.8% |
| Immigrants | Belgium | 97.3 /100 | #101 | Exceptional 19.8% |
| Immigrants | Cameroon | 97.3 /100 | #102 | Exceptional 19.8% |
| Immigrants | Southern Europe | 97.1 /100 | #103 | Exceptional 19.9% |
| Chileans | 96.9 /100 | #104 | Exceptional 19.9% |
| Israelis | 96.9 /100 | #105 | Exceptional 19.9% |
| Ethiopians | 96.7 /100 | #106 | Exceptional 19.9% |
| Immigrants | Syria | 96.7 /100 | #107 | Exceptional 19.9% |
| Native Hawaiians | 96.6 /100 | #108 | Exceptional 19.9% |
| Colombians | 96.6 /100 | #109 | Exceptional 19.9% |
| Immigrants | Western Asia | 96.5 /100 | #110 | Exceptional 19.9% |
| Carpatho Rusyns | 96.1 /100 | #111 | Exceptional 20.0% |
| Immigrants | Netherlands | 96.0 /100 | #112 | Exceptional 20.0% |
Demographics Similar to Somalis by Single Female Poverty
In terms of single female poverty, the demographic groups most similar to Somalis are Immigrants from Congo (25.3%, a difference of 0.27%), Immigrants from Dominican Republic (25.3%, a difference of 0.28%), Immigrants from Mexico (25.3%, a difference of 0.38%), Shoshone (25.1%, a difference of 0.40%), and Honduran (25.1%, a difference of 0.48%).
| Demographics | Rating | Rank | Single Female Poverty |
| Africans | 0.0 /100 | #296 | Tragic 24.8% |
| Immigrants | Central America | 0.0 /100 | #297 | Tragic 24.8% |
| Yaqui | 0.0 /100 | #298 | Tragic 24.9% |
| Mexicans | 0.0 /100 | #299 | Tragic 25.0% |
| Blackfeet | 0.0 /100 | #300 | Tragic 25.1% |
| Hondurans | 0.0 /100 | #301 | Tragic 25.1% |
| Shoshone | 0.0 /100 | #302 | Tragic 25.1% |
| Somalis | 0.0 /100 | #303 | Tragic 25.2% |
| Immigrants | Congo | 0.0 /100 | #304 | Tragic 25.3% |
| Immigrants | Dominican Republic | 0.0 /100 | #305 | Tragic 25.3% |
| Immigrants | Mexico | 0.0 /100 | #306 | Tragic 25.3% |
| Potawatomi | 0.0 /100 | #307 | Tragic 25.4% |
| Aleuts | 0.0 /100 | #308 | Tragic 25.4% |
| Dominicans | 0.0 /100 | #309 | Tragic 25.4% |
| Central American Indians | 0.0 /100 | #310 | Tragic 25.5% |