Israeli vs Northern European Median Earnings
COMPARE
Israeli
Northern European
Median Earnings
Median Earnings Comparison
Israelis
Northern Europeans
$52,937
MEDIAN EARNINGS
100.0/ 100
METRIC RATING
40th/ 347
METRIC RANK
$48,887
MEDIAN EARNINGS
96.9/ 100
METRIC RATING
112th/ 347
METRIC RANK
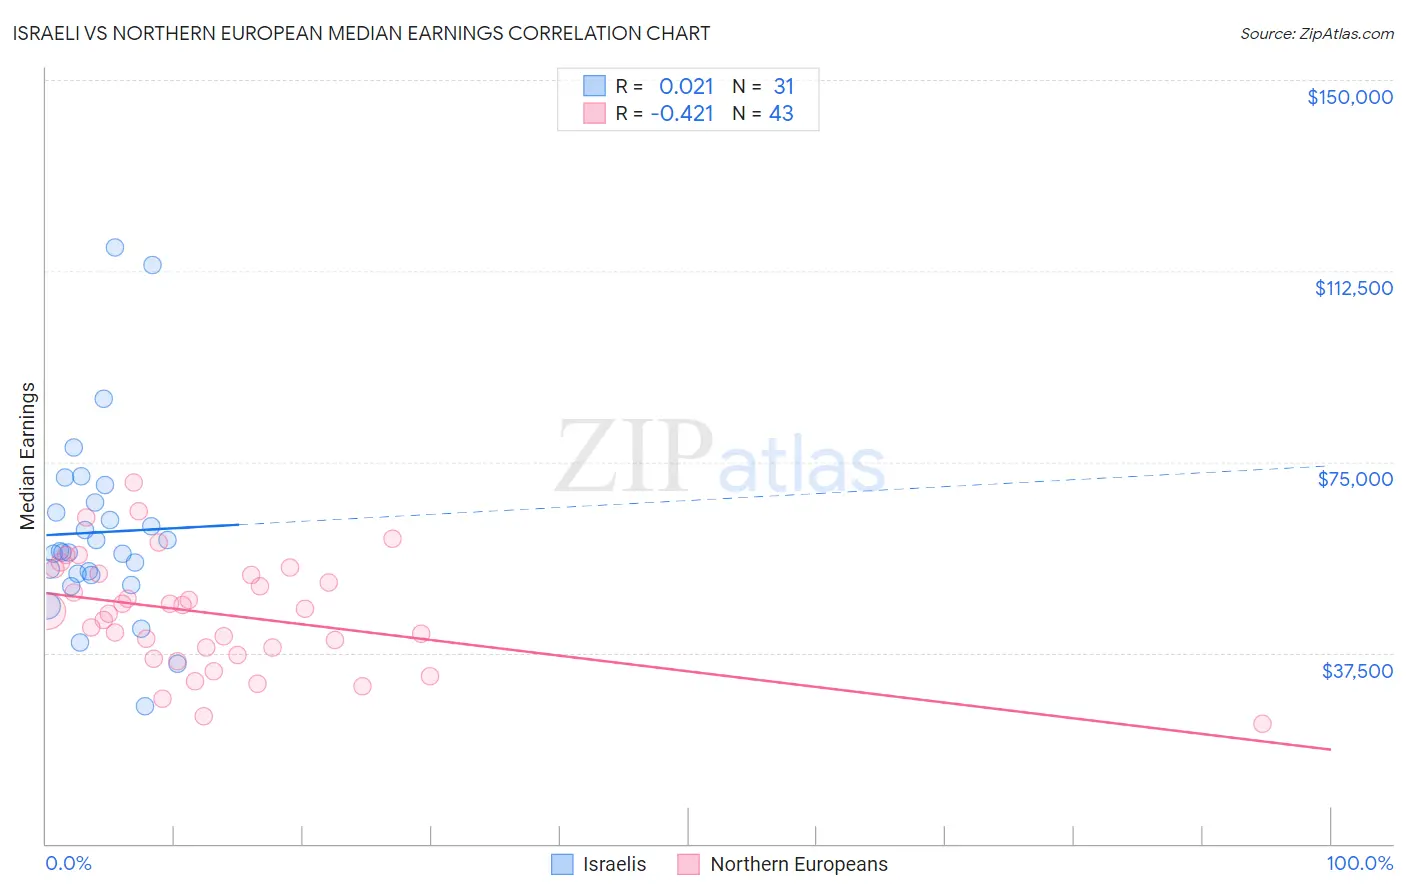
Israeli vs Northern European Median Earnings Correlation Chart
The statistical analysis conducted on geographies consisting of 211,215,841 people shows no correlation between the proportion of Israelis and median earnings in the United States with a correlation coefficient (R) of 0.021 and weighted average of $52,937. Similarly, the statistical analysis conducted on geographies consisting of 406,030,818 people shows a moderate negative correlation between the proportion of Northern Europeans and median earnings in the United States with a correlation coefficient (R) of -0.421 and weighted average of $48,887, a difference of 8.3%.
Median Earnings Correlation Summary
| Measurement | Israeli | Northern European |
| Minimum | $27,000 | $23,571 |
| Maximum | $117,019 | $70,939 |
| Range | $90,019 | $47,368 |
| Mean | $61,168 | $45,160 |
| Median | $57,256 | $45,714 |
| Interquartile 25% (IQ1) | $52,851 | $37,035 |
| Interquartile 75% (IQ3) | $67,052 | $52,998 |
| Interquartile Range (IQR) | $14,202 | $15,963 |
| Standard Deviation (Sample) | $18,863 | $10,934 |
| Standard Deviation (Population) | $18,557 | $10,806 |
Similar Demographics by Median Earnings
Demographics Similar to Israelis by Median Earnings
In terms of median earnings, the demographic groups most similar to Israelis are Immigrants from Turkey ($52,960, a difference of 0.040%), Latvian ($53,001, a difference of 0.12%), Immigrants from Belarus ($53,043, a difference of 0.20%), Immigrants from Lithuania ($52,769, a difference of 0.32%), and Immigrants from Denmark ($53,186, a difference of 0.47%).
| Demographics | Rating | Rank | Median Earnings |
| Immigrants | Greece | 100.0 /100 | #33 | Exceptional $53,282 |
| Immigrants | Sri Lanka | 100.0 /100 | #34 | Exceptional $53,268 |
| Immigrants | Switzerland | 100.0 /100 | #35 | Exceptional $53,211 |
| Immigrants | Denmark | 100.0 /100 | #36 | Exceptional $53,186 |
| Immigrants | Belarus | 100.0 /100 | #37 | Exceptional $53,043 |
| Latvians | 100.0 /100 | #38 | Exceptional $53,001 |
| Immigrants | Turkey | 100.0 /100 | #39 | Exceptional $52,960 |
| Israelis | 100.0 /100 | #40 | Exceptional $52,937 |
| Immigrants | Lithuania | 100.0 /100 | #41 | Exceptional $52,769 |
| Maltese | 100.0 /100 | #42 | Exceptional $52,526 |
| Immigrants | Malaysia | 100.0 /100 | #43 | Exceptional $52,514 |
| Bulgarians | 100.0 /100 | #44 | Exceptional $52,512 |
| Immigrants | Czechoslovakia | 100.0 /100 | #45 | Exceptional $52,361 |
| Bhutanese | 100.0 /100 | #46 | Exceptional $52,297 |
| Australians | 100.0 /100 | #47 | Exceptional $52,294 |
Demographics Similar to Northern Europeans by Median Earnings
In terms of median earnings, the demographic groups most similar to Northern Europeans are Immigrants from Zimbabwe ($48,913, a difference of 0.050%), Immigrants from Kuwait ($48,861, a difference of 0.050%), Immigrants from Ethiopia ($48,924, a difference of 0.070%), Syrian ($48,934, a difference of 0.10%), and Moroccan ($48,838, a difference of 0.10%).
| Demographics | Rating | Rank | Median Earnings |
| Immigrants | Western Asia | 98.4 /100 | #105 | Exceptional $49,389 |
| Immigrants | Albania | 98.4 /100 | #106 | Exceptional $49,377 |
| Immigrants | Morocco | 98.4 /100 | #107 | Exceptional $49,368 |
| Palestinians | 98.0 /100 | #108 | Exceptional $49,209 |
| Syrians | 97.1 /100 | #109 | Exceptional $48,934 |
| Immigrants | Ethiopia | 97.1 /100 | #110 | Exceptional $48,924 |
| Immigrants | Zimbabwe | 97.0 /100 | #111 | Exceptional $48,913 |
| Northern Europeans | 96.9 /100 | #112 | Exceptional $48,887 |
| Immigrants | Kuwait | 96.8 /100 | #113 | Exceptional $48,861 |
| Moroccans | 96.7 /100 | #114 | Exceptional $48,838 |
| Chinese | 96.7 /100 | #115 | Exceptional $48,836 |
| Koreans | 96.2 /100 | #116 | Exceptional $48,727 |
| Serbians | 95.9 /100 | #117 | Exceptional $48,677 |
| Immigrants | Jordan | 95.9 /100 | #118 | Exceptional $48,673 |
| Poles | 95.8 /100 | #119 | Exceptional $48,659 |