Israeli vs Immigrants from Peru Single Female Poverty
COMPARE
Israeli
Immigrants from Peru
Single Female Poverty
Single Female Poverty Comparison
Israelis
Immigrants from Peru
19.9%
SINGLE FEMALE POVERTY
96.9/ 100
METRIC RATING
105th/ 347
METRIC RANK
19.3%
SINGLE FEMALE POVERTY
99.4/ 100
METRIC RATING
73rd/ 347
METRIC RANK
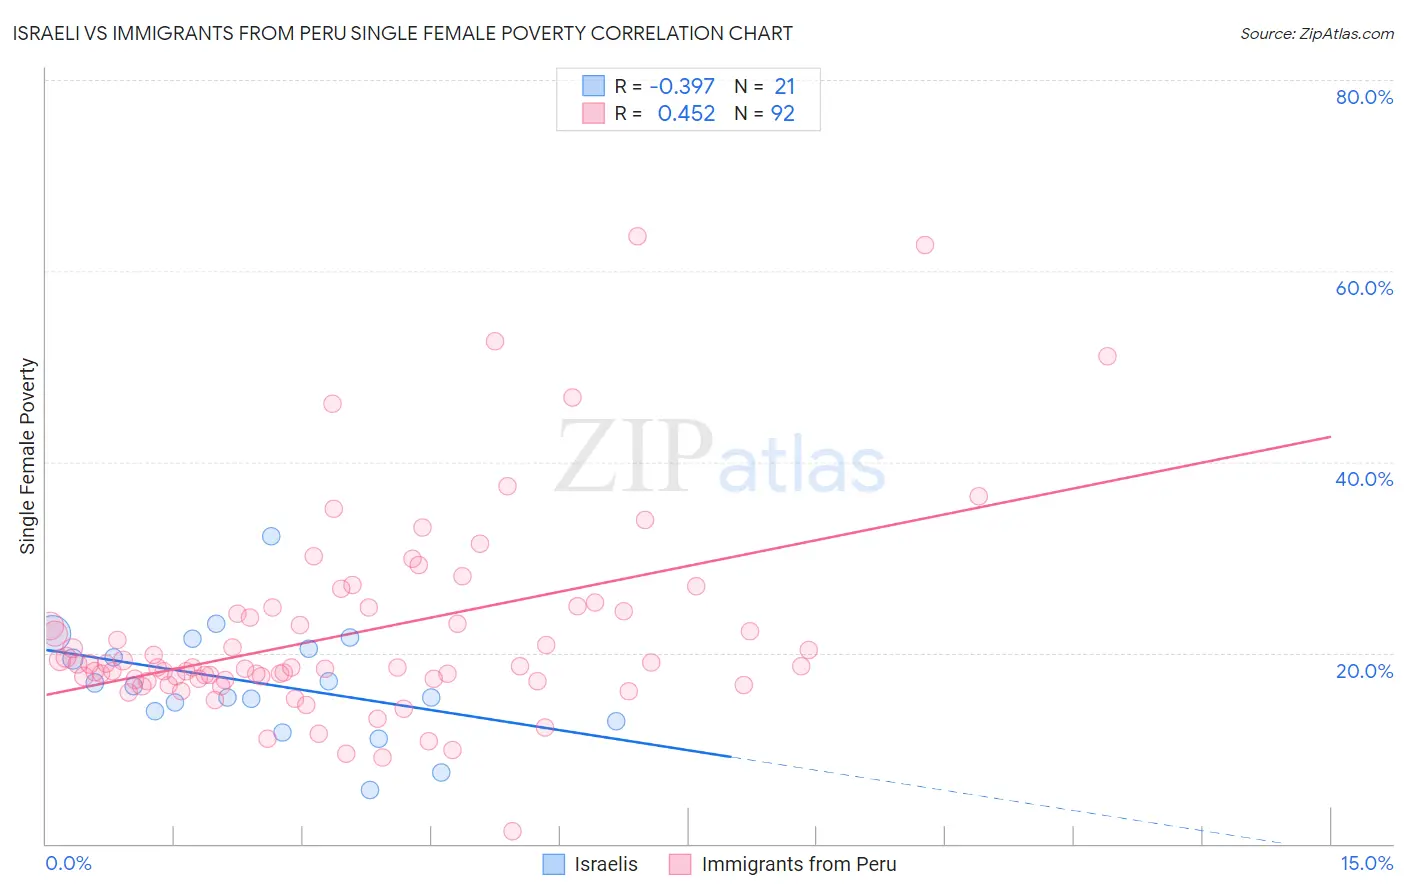
Israeli vs Immigrants from Peru Single Female Poverty Correlation Chart
The statistical analysis conducted on geographies consisting of 208,686,807 people shows a mild negative correlation between the proportion of Israelis and poverty level among single females in the United States with a correlation coefficient (R) of -0.397 and weighted average of 19.9%. Similarly, the statistical analysis conducted on geographies consisting of 325,235,635 people shows a moderate positive correlation between the proportion of Immigrants from Peru and poverty level among single females in the United States with a correlation coefficient (R) of 0.452 and weighted average of 19.3%, a difference of 2.8%.
Single Female Poverty Correlation Summary
| Measurement | Israeli | Immigrants from Peru |
| Minimum | 5.6% | 1.3% |
| Maximum | 32.2% | 63.6% |
| Range | 26.6% | 62.3% |
| Mean | 16.8% | 22.1% |
| Median | 16.5% | 18.5% |
| Interquartile 25% (IQ1) | 13.4% | 17.2% |
| Interquartile 75% (IQ3) | 21.0% | 24.5% |
| Interquartile Range (IQR) | 7.6% | 7.3% |
| Standard Deviation (Sample) | 5.8% | 10.5% |
| Standard Deviation (Population) | 5.7% | 10.5% |
Similar Demographics by Single Female Poverty
Demographics Similar to Israelis by Single Female Poverty
In terms of single female poverty, the demographic groups most similar to Israelis are Chilean (19.9%, a difference of 0.010%), Ethiopian (19.9%, a difference of 0.090%), Immigrants from Syria (19.9%, a difference of 0.11%), Immigrants from Southern Europe (19.9%, a difference of 0.13%), and Native Hawaiian (19.9%, a difference of 0.16%).
| Demographics | Rating | Rank | Single Female Poverty |
| Immigrants | France | 97.9 /100 | #98 | Exceptional 19.7% |
| Sierra Leoneans | 97.9 /100 | #99 | Exceptional 19.7% |
| Ukrainians | 97.6 /100 | #100 | Exceptional 19.8% |
| Immigrants | Belgium | 97.3 /100 | #101 | Exceptional 19.8% |
| Immigrants | Cameroon | 97.3 /100 | #102 | Exceptional 19.8% |
| Immigrants | Southern Europe | 97.1 /100 | #103 | Exceptional 19.9% |
| Chileans | 96.9 /100 | #104 | Exceptional 19.9% |
| Israelis | 96.9 /100 | #105 | Exceptional 19.9% |
| Ethiopians | 96.7 /100 | #106 | Exceptional 19.9% |
| Immigrants | Syria | 96.7 /100 | #107 | Exceptional 19.9% |
| Native Hawaiians | 96.6 /100 | #108 | Exceptional 19.9% |
| Colombians | 96.6 /100 | #109 | Exceptional 19.9% |
| Immigrants | Western Asia | 96.5 /100 | #110 | Exceptional 19.9% |
| Carpatho Rusyns | 96.1 /100 | #111 | Exceptional 20.0% |
| Immigrants | Netherlands | 96.0 /100 | #112 | Exceptional 20.0% |
Demographics Similar to Immigrants from Peru by Single Female Poverty
In terms of single female poverty, the demographic groups most similar to Immigrants from Peru are Immigrants from Belarus (19.3%, a difference of 0.010%), Immigrants from Turkey (19.4%, a difference of 0.050%), Peruvian (19.4%, a difference of 0.090%), Immigrants from South Eastern Asia (19.3%, a difference of 0.10%), and Immigrants from Latvia (19.3%, a difference of 0.10%).
| Demographics | Rating | Rank | Single Female Poverty |
| Palestinians | 99.6 /100 | #66 | Exceptional 19.2% |
| Immigrants | Egypt | 99.6 /100 | #67 | Exceptional 19.2% |
| Laotians | 99.5 /100 | #68 | Exceptional 19.3% |
| Paraguayans | 99.5 /100 | #69 | Exceptional 19.3% |
| Immigrants | Jordan | 99.4 /100 | #70 | Exceptional 19.3% |
| Immigrants | South Eastern Asia | 99.4 /100 | #71 | Exceptional 19.3% |
| Immigrants | Latvia | 99.4 /100 | #72 | Exceptional 19.3% |
| Immigrants | Peru | 99.4 /100 | #73 | Exceptional 19.3% |
| Immigrants | Belarus | 99.4 /100 | #74 | Exceptional 19.3% |
| Immigrants | Turkey | 99.4 /100 | #75 | Exceptional 19.4% |
| Peruvians | 99.4 /100 | #76 | Exceptional 19.4% |
| Immigrants | Russia | 99.3 /100 | #77 | Exceptional 19.4% |
| Albanians | 99.3 /100 | #78 | Exceptional 19.4% |
| Immigrants | Sierra Leone | 99.3 /100 | #79 | Exceptional 19.4% |
| Immigrants | Australia | 99.3 /100 | #80 | Exceptional 19.4% |