Iroquois vs Immigrants from Eritrea Family Poverty
COMPARE
Iroquois
Immigrants from Eritrea
Family Poverty
Family Poverty Comparison
Iroquois
Immigrants from Eritrea
10.7%
FAMILY POVERTY
0.3/ 100
METRIC RATING
251st/ 347
METRIC RANK
9.9%
FAMILY POVERTY
5.4/ 100
METRIC RATING
219th/ 347
METRIC RANK
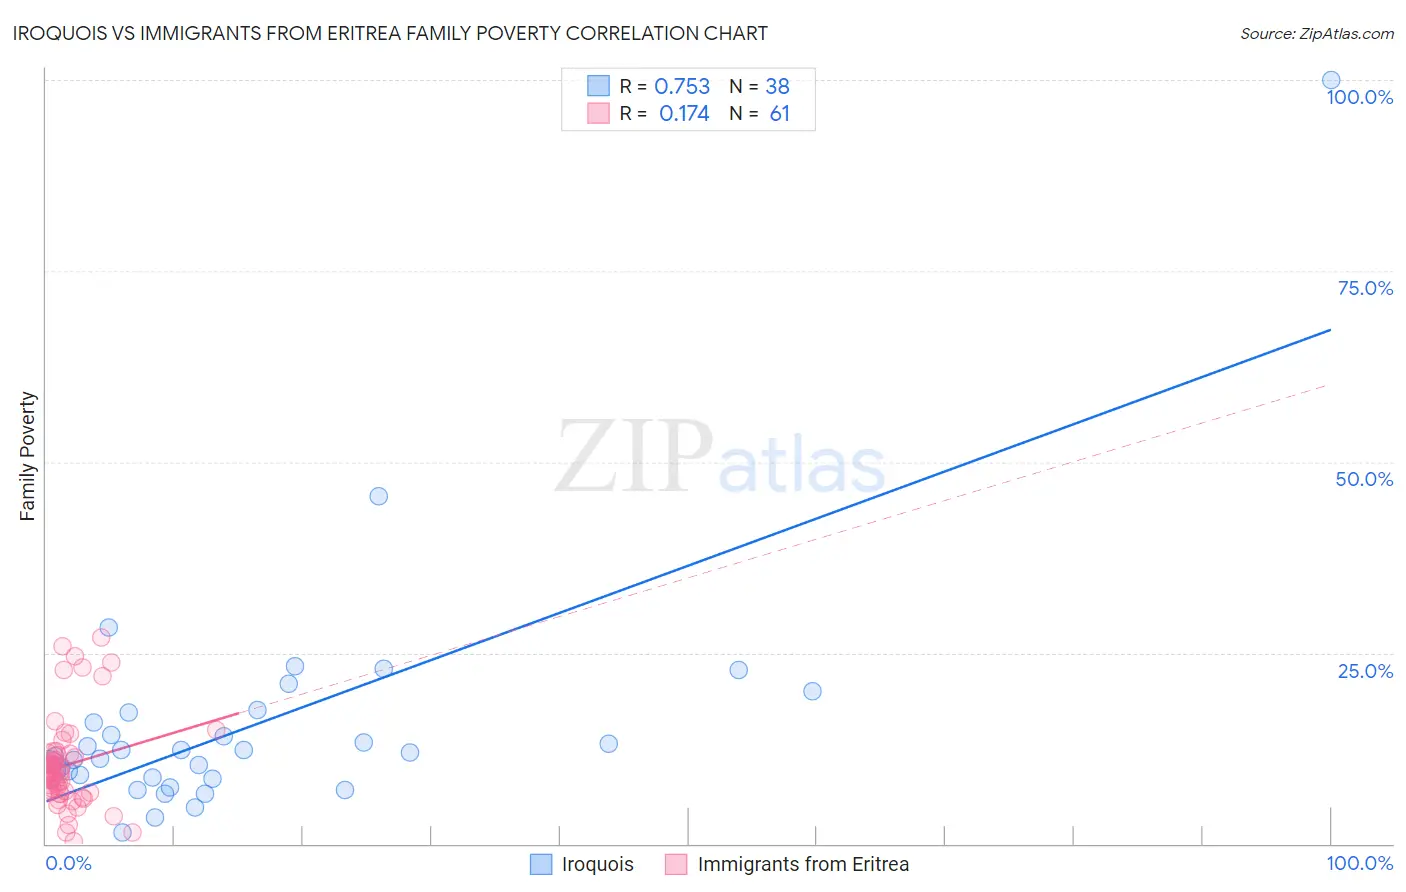
Iroquois vs Immigrants from Eritrea Family Poverty Correlation Chart
The statistical analysis conducted on geographies consisting of 207,014,123 people shows a strong positive correlation between the proportion of Iroquois and poverty level among families in the United States with a correlation coefficient (R) of 0.753 and weighted average of 10.7%. Similarly, the statistical analysis conducted on geographies consisting of 104,784,674 people shows a poor positive correlation between the proportion of Immigrants from Eritrea and poverty level among families in the United States with a correlation coefficient (R) of 0.174 and weighted average of 9.9%, a difference of 8.8%.
Family Poverty Correlation Summary
| Measurement | Iroquois | Immigrants from Eritrea |
| Minimum | 1.5% | 0.28% |
| Maximum | 100.0% | 27.0% |
| Range | 98.5% | 26.7% |
| Mean | 15.6% | 10.3% |
| Median | 12.1% | 9.2% |
| Interquartile 25% (IQ1) | 8.6% | 6.7% |
| Interquartile 75% (IQ3) | 17.2% | 11.7% |
| Interquartile Range (IQR) | 8.6% | 5.0% |
| Standard Deviation (Sample) | 16.1% | 6.0% |
| Standard Deviation (Population) | 15.9% | 5.9% |
Similar Demographics by Family Poverty
Demographics Similar to Iroquois by Family Poverty
In terms of family poverty, the demographic groups most similar to Iroquois are Immigrants from Zaire (10.7%, a difference of 0.12%), Immigrants from Western Africa (10.7%, a difference of 0.23%), Salvadoran (10.7%, a difference of 0.28%), Ecuadorian (10.8%, a difference of 0.53%), and Cuban (10.6%, a difference of 0.81%).
| Demographics | Rating | Rank | Family Poverty |
| Cree | 0.7 /100 | #244 | Tragic 10.5% |
| Immigrants | Burma/Myanmar | 0.6 /100 | #245 | Tragic 10.5% |
| Cherokee | 0.5 /100 | #246 | Tragic 10.6% |
| Liberians | 0.4 /100 | #247 | Tragic 10.6% |
| Nicaraguans | 0.4 /100 | #248 | Tragic 10.6% |
| Cubans | 0.4 /100 | #249 | Tragic 10.6% |
| Salvadorans | 0.3 /100 | #250 | Tragic 10.7% |
| Iroquois | 0.3 /100 | #251 | Tragic 10.7% |
| Immigrants | Zaire | 0.3 /100 | #252 | Tragic 10.7% |
| Immigrants | Western Africa | 0.3 /100 | #253 | Tragic 10.7% |
| Ecuadorians | 0.2 /100 | #254 | Tragic 10.8% |
| Immigrants | Liberia | 0.2 /100 | #255 | Tragic 10.8% |
| Chickasaw | 0.2 /100 | #256 | Tragic 10.8% |
| Immigrants | Ghana | 0.2 /100 | #257 | Tragic 10.8% |
| Sub-Saharan Africans | 0.2 /100 | #258 | Tragic 10.9% |
Demographics Similar to Immigrants from Eritrea by Family Poverty
In terms of family poverty, the demographic groups most similar to Immigrants from Eritrea are Bermudan (9.9%, a difference of 0.060%), Panamanian (9.8%, a difference of 0.13%), Immigrants from Cambodia (9.9%, a difference of 0.33%), Japanese (9.9%, a difference of 0.36%), and American (9.8%, a difference of 0.44%).
| Demographics | Rating | Rank | Family Poverty |
| Immigrants | Thailand | 9.7 /100 | #212 | Tragic 9.7% |
| Osage | 8.0 /100 | #213 | Tragic 9.7% |
| Immigrants | Micronesia | 6.7 /100 | #214 | Tragic 9.8% |
| Immigrants | Nonimmigrants | 6.7 /100 | #215 | Tragic 9.8% |
| Moroccans | 6.5 /100 | #216 | Tragic 9.8% |
| Americans | 6.2 /100 | #217 | Tragic 9.8% |
| Panamanians | 5.6 /100 | #218 | Tragic 9.8% |
| Immigrants | Eritrea | 5.4 /100 | #219 | Tragic 9.9% |
| Bermudans | 5.3 /100 | #220 | Tragic 9.9% |
| Immigrants | Cambodia | 4.8 /100 | #221 | Tragic 9.9% |
| Japanese | 4.8 /100 | #222 | Tragic 9.9% |
| Immigrants | Africa | 4.3 /100 | #223 | Tragic 9.9% |
| Marshallese | 3.9 /100 | #224 | Tragic 9.9% |
| Immigrants | Immigrants | 3.6 /100 | #225 | Tragic 10.0% |
| Ottawa | 3.3 /100 | #226 | Tragic 10.0% |