Iroquois vs Immigrants from Eritrea No Vehicles in Household
COMPARE
Iroquois
Immigrants from Eritrea
No Vehicles in Household
No Vehicles in Household Comparison
Iroquois
Immigrants from Eritrea
10.9%
NO VEHICLES IN HOUSEHOLD
17.6/ 100
METRIC RATING
203rd/ 347
METRIC RANK
10.6%
NO VEHICLES IN HOUSEHOLD
36.3/ 100
METRIC RATING
189th/ 347
METRIC RANK
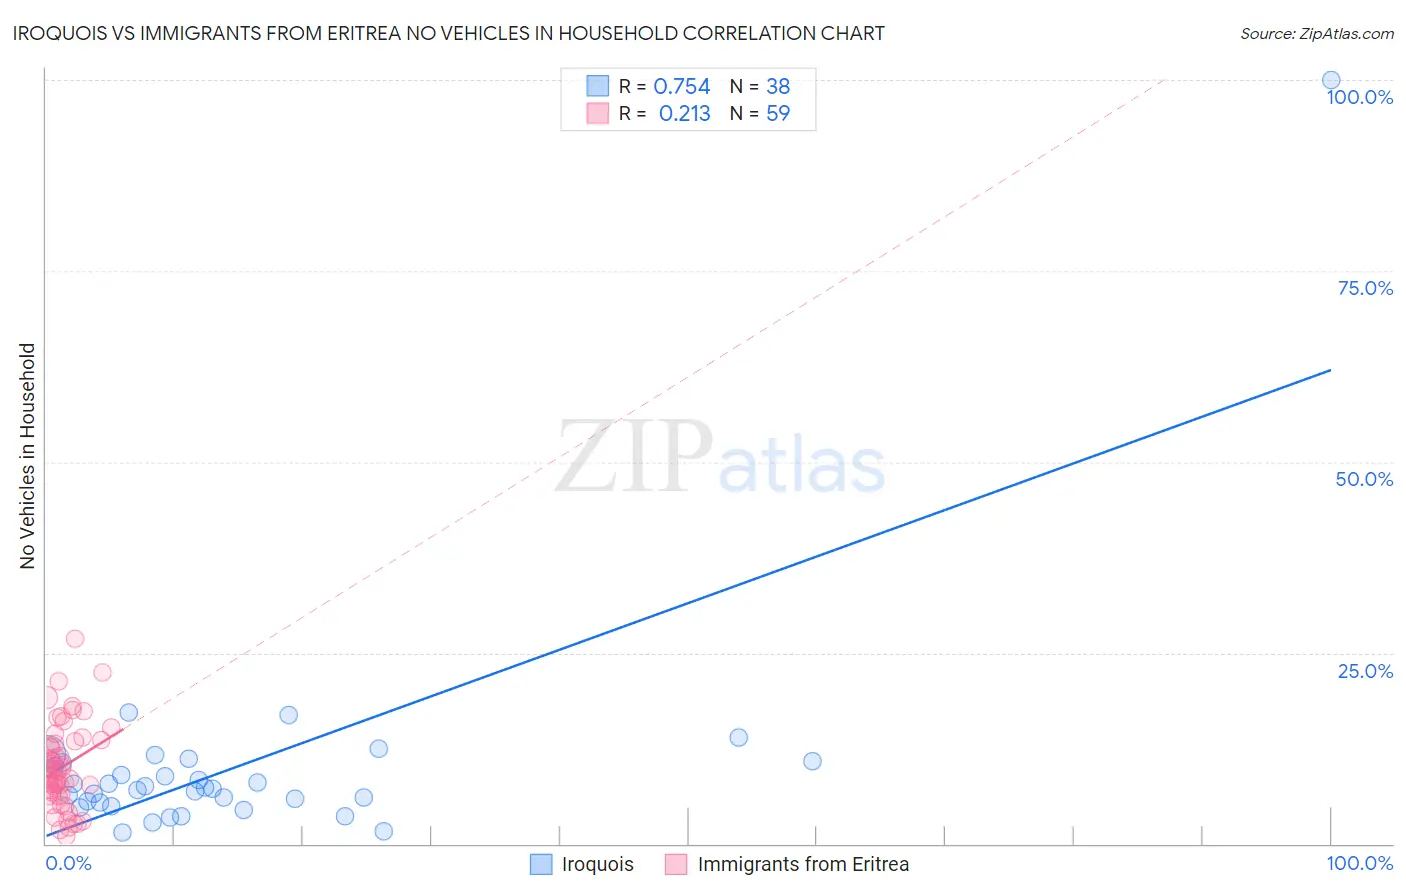
Iroquois vs Immigrants from Eritrea No Vehicles in Household Correlation Chart
The statistical analysis conducted on geographies consisting of 206,994,531 people shows a strong positive correlation between the proportion of Iroquois and percentage of households with no vehicle available in the United States with a correlation coefficient (R) of 0.754 and weighted average of 10.9%. Similarly, the statistical analysis conducted on geographies consisting of 104,832,678 people shows a weak positive correlation between the proportion of Immigrants from Eritrea and percentage of households with no vehicle available in the United States with a correlation coefficient (R) of 0.213 and weighted average of 10.6%, a difference of 3.3%.
No Vehicles in Household Correlation Summary
| Measurement | Iroquois | Immigrants from Eritrea |
| Minimum | 1.5% | 0.94% |
| Maximum | 100.0% | 26.8% |
| Range | 98.5% | 25.8% |
| Mean | 10.1% | 10.1% |
| Median | 7.3% | 9.6% |
| Interquartile 25% (IQ1) | 5.5% | 6.4% |
| Interquartile 75% (IQ3) | 10.7% | 13.4% |
| Interquartile Range (IQR) | 5.2% | 7.1% |
| Standard Deviation (Sample) | 15.4% | 5.5% |
| Standard Deviation (Population) | 15.2% | 5.4% |
Demographics Similar to Iroquois and Immigrants from Eritrea by No Vehicles in Household
In terms of no vehicles in household, the demographic groups most similar to Iroquois are Romanian (10.9%, a difference of 0.070%), Immigrants from Western Europe (10.9%, a difference of 0.34%), Guatemalan (11.0%, a difference of 0.34%), Immigrants from Chile (11.0%, a difference of 0.38%), and Somali (11.0%, a difference of 0.39%). Similarly, the demographic groups most similar to Immigrants from Eritrea are Immigrants from Armenia (10.6%, a difference of 0.18%), Immigrants from North Macedonia (10.6%, a difference of 0.23%), Immigrants from Poland (10.6%, a difference of 0.30%), Immigrants from Northern Europe (10.7%, a difference of 0.47%), and Carpatho Rusyn (10.7%, a difference of 0.61%).
| Demographics | Rating | Rank | No Vehicles in Household |
| German Russians | 40.6 /100 | #186 | Average 10.5% |
| Immigrants | Poland | 38.4 /100 | #187 | Fair 10.6% |
| Immigrants | Armenia | 37.5 /100 | #188 | Fair 10.6% |
| Immigrants | Eritrea | 36.3 /100 | #189 | Fair 10.6% |
| Immigrants | North Macedonia | 34.6 /100 | #190 | Fair 10.6% |
| Immigrants | Northern Europe | 33.1 /100 | #191 | Fair 10.7% |
| Carpatho Rusyns | 32.1 /100 | #192 | Fair 10.7% |
| Ukrainians | 28.0 /100 | #193 | Fair 10.7% |
| Pueblo | 27.0 /100 | #194 | Fair 10.8% |
| Immigrants | Brazil | 26.3 /100 | #195 | Fair 10.8% |
| Central Americans | 24.3 /100 | #196 | Fair 10.8% |
| Shoshone | 24.1 /100 | #197 | Fair 10.8% |
| Immigrants | Sweden | 22.9 /100 | #198 | Fair 10.8% |
| Immigrants | Asia | 21.3 /100 | #199 | Fair 10.9% |
| Cambodians | 19.6 /100 | #200 | Poor 10.9% |
| Immigrants | Western Europe | 19.1 /100 | #201 | Poor 10.9% |
| Romanians | 17.9 /100 | #202 | Poor 10.9% |
| Iroquois | 17.6 /100 | #203 | Poor 10.9% |
| Guatemalans | 16.1 /100 | #204 | Poor 11.0% |
| Immigrants | Chile | 15.9 /100 | #205 | Poor 11.0% |
| Somalis | 15.9 /100 | #206 | Poor 11.0% |