Immigrants from Micronesia vs Belgian Single Female Poverty
COMPARE
Immigrants from Micronesia
Belgian
Single Female Poverty
Single Female Poverty Comparison
Immigrants from Micronesia
Belgians
23.0%
SINGLE FEMALE POVERTY
0.2/ 100
METRIC RATING
266th/ 347
METRIC RANK
21.5%
SINGLE FEMALE POVERTY
16.1/ 100
METRIC RATING
206th/ 347
METRIC RANK
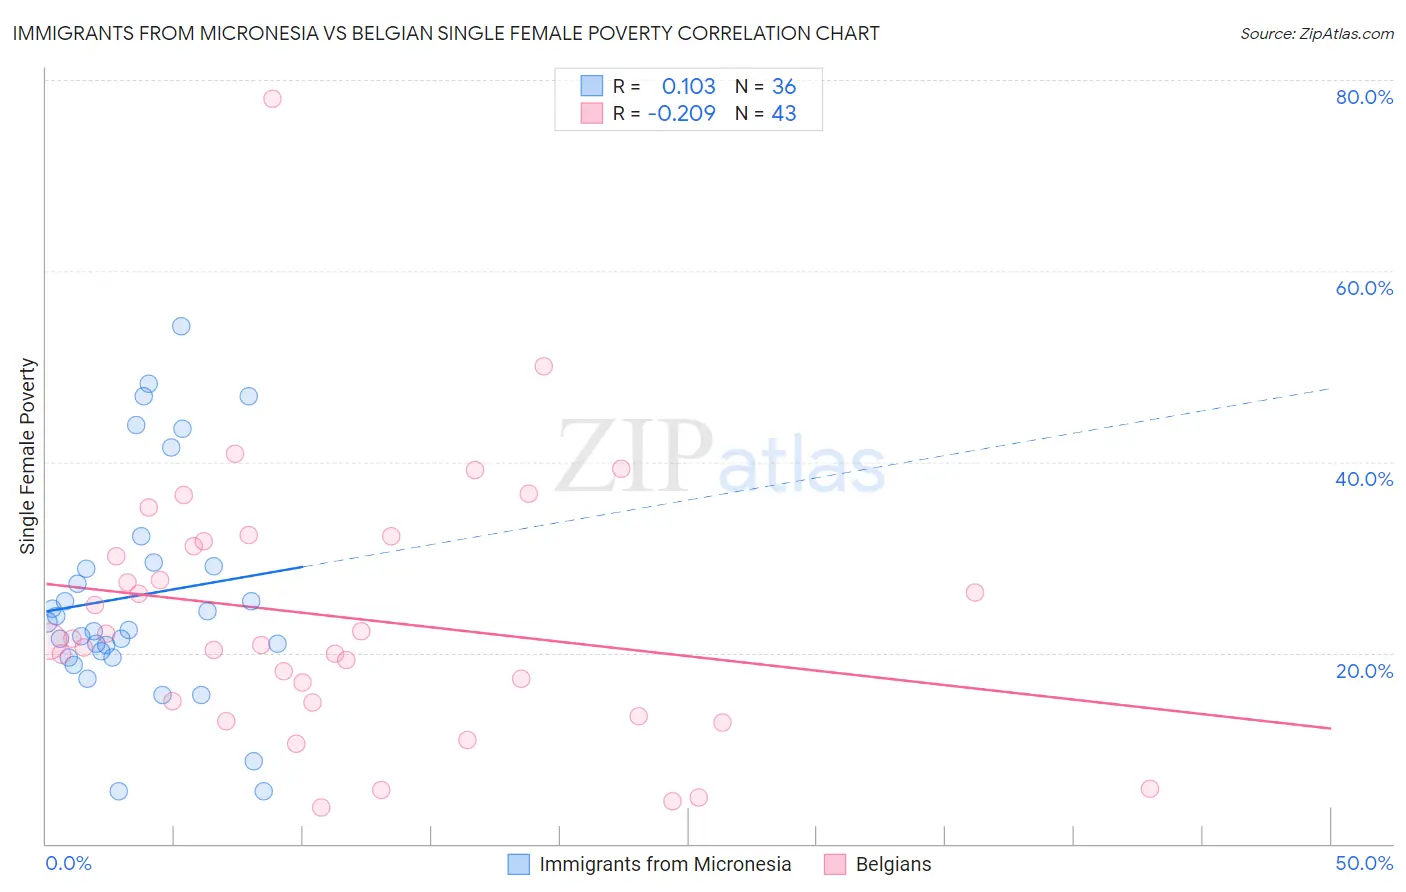
Immigrants from Micronesia vs Belgian Single Female Poverty Correlation Chart
The statistical analysis conducted on geographies consisting of 61,492,731 people shows a poor positive correlation between the proportion of Immigrants from Micronesia and poverty level among single females in the United States with a correlation coefficient (R) of 0.103 and weighted average of 23.0%. Similarly, the statistical analysis conducted on geographies consisting of 349,903,575 people shows a weak negative correlation between the proportion of Belgians and poverty level among single females in the United States with a correlation coefficient (R) of -0.209 and weighted average of 21.5%, a difference of 6.9%.
Single Female Poverty Correlation Summary
| Measurement | Immigrants from Micronesia | Belgian |
| Minimum | 5.4% | 3.8% |
| Maximum | 54.2% | 78.0% |
| Range | 48.7% | 74.2% |
| Mean | 26.0% | 23.7% |
| Median | 22.8% | 21.2% |
| Interquartile 25% (IQ1) | 19.8% | 14.8% |
| Interquartile 75% (IQ3) | 29.2% | 31.6% |
| Interquartile Range (IQR) | 9.4% | 16.8% |
| Standard Deviation (Sample) | 11.8% | 13.9% |
| Standard Deviation (Population) | 11.6% | 13.7% |
Similar Demographics by Single Female Poverty
Demographics Similar to Immigrants from Micronesia by Single Female Poverty
In terms of single female poverty, the demographic groups most similar to Immigrants from Micronesia are Senegalese (23.0%, a difference of 0.060%), Fijian (23.1%, a difference of 0.13%), Hmong (23.1%, a difference of 0.16%), Central American (23.0%, a difference of 0.21%), and Immigrants from Laos (22.9%, a difference of 0.38%).
| Demographics | Rating | Rank | Single Female Poverty |
| Whites/Caucasians | 0.6 /100 | #259 | Tragic 22.7% |
| Celtics | 0.5 /100 | #260 | Tragic 22.7% |
| Immigrants | Cabo Verde | 0.4 /100 | #261 | Tragic 22.8% |
| British West Indians | 0.4 /100 | #262 | Tragic 22.8% |
| Scotch-Irish | 0.3 /100 | #263 | Tragic 22.9% |
| Immigrants | Laos | 0.3 /100 | #264 | Tragic 22.9% |
| Central Americans | 0.2 /100 | #265 | Tragic 23.0% |
| Immigrants | Micronesia | 0.2 /100 | #266 | Tragic 23.0% |
| Senegalese | 0.2 /100 | #267 | Tragic 23.0% |
| Fijians | 0.2 /100 | #268 | Tragic 23.1% |
| Hmong | 0.2 /100 | #269 | Tragic 23.1% |
| Inupiat | 0.2 /100 | #270 | Tragic 23.1% |
| Sub-Saharan Africans | 0.1 /100 | #271 | Tragic 23.2% |
| Immigrants | Senegal | 0.1 /100 | #272 | Tragic 23.2% |
| Alaska Natives | 0.1 /100 | #273 | Tragic 23.3% |
Demographics Similar to Belgians by Single Female Poverty
In terms of single female poverty, the demographic groups most similar to Belgians are Finnish (21.5%, a difference of 0.020%), Ghanaian (21.6%, a difference of 0.040%), Immigrants from Africa (21.5%, a difference of 0.070%), Haitian (21.6%, a difference of 0.070%), and Immigrants from Eastern Africa (21.6%, a difference of 0.11%).
| Demographics | Rating | Rank | Single Female Poverty |
| Immigrants | Immigrants | 22.0 /100 | #199 | Fair 21.4% |
| Irish | 21.4 /100 | #200 | Fair 21.4% |
| Nigerians | 20.9 /100 | #201 | Fair 21.4% |
| Immigrants | Kenya | 20.7 /100 | #202 | Fair 21.4% |
| Immigrants | Haiti | 18.8 /100 | #203 | Poor 21.5% |
| Immigrants | Africa | 16.7 /100 | #204 | Poor 21.5% |
| Finns | 16.2 /100 | #205 | Poor 21.5% |
| Belgians | 16.1 /100 | #206 | Poor 21.5% |
| Ghanaians | 15.7 /100 | #207 | Poor 21.6% |
| Haitians | 15.4 /100 | #208 | Poor 21.6% |
| Immigrants | Eastern Africa | 15.1 /100 | #209 | Poor 21.6% |
| Immigrants | Panama | 14.4 /100 | #210 | Poor 21.6% |
| Icelanders | 14.0 /100 | #211 | Poor 21.6% |
| Jamaicans | 14.0 /100 | #212 | Poor 21.6% |
| Guamanians/Chamorros | 13.7 /100 | #213 | Poor 21.6% |