Korean vs Belgian Single Female Poverty
COMPARE
Korean
Belgian
Single Female Poverty
Single Female Poverty Comparison
Koreans
Belgians
18.6%
SINGLE FEMALE POVERTY
99.9/ 100
METRIC RATING
34th/ 347
METRIC RANK
21.5%
SINGLE FEMALE POVERTY
16.1/ 100
METRIC RATING
206th/ 347
METRIC RANK
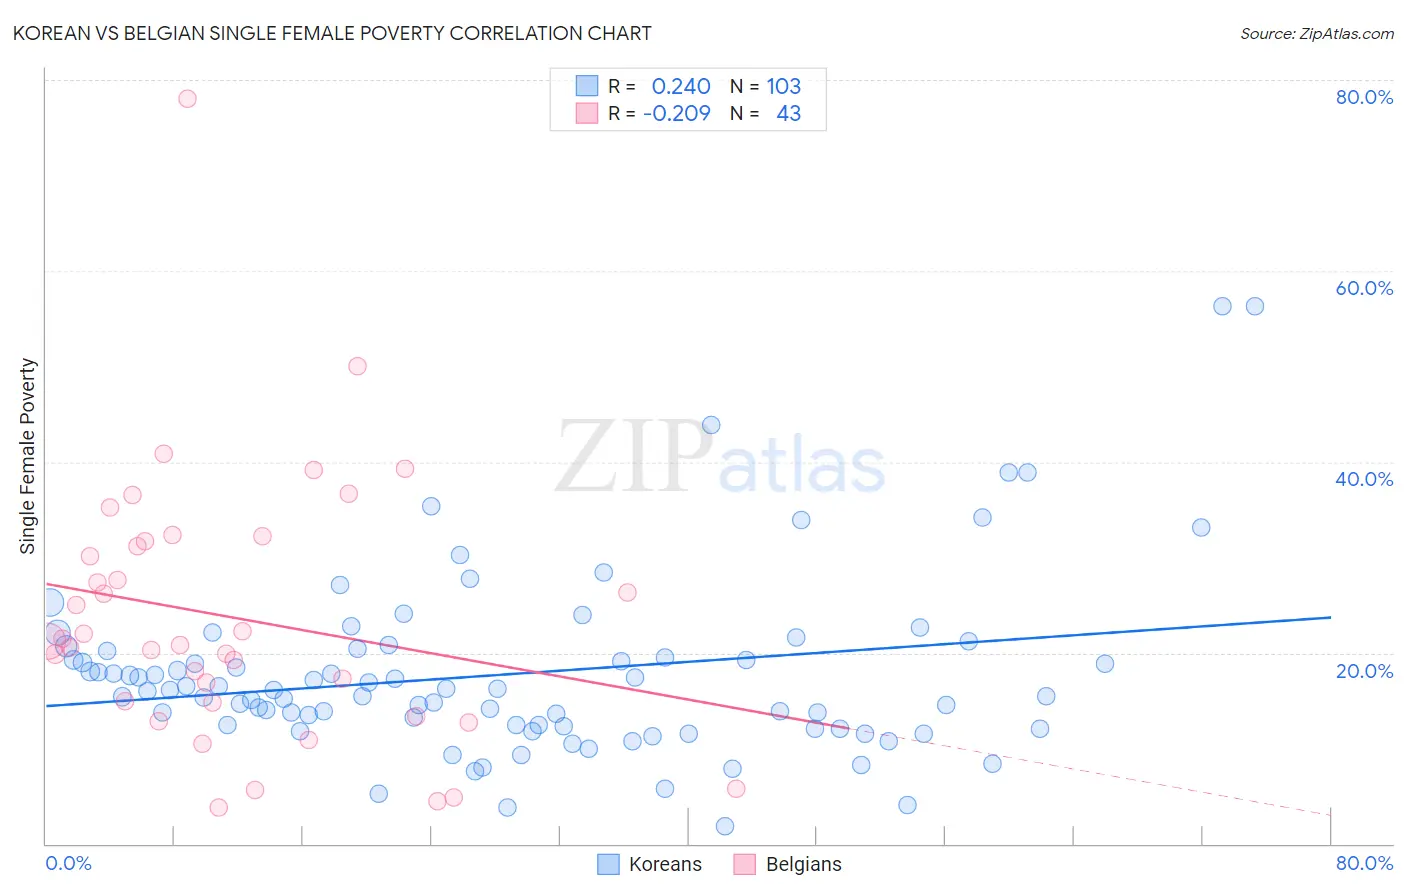
Korean vs Belgian Single Female Poverty Correlation Chart
The statistical analysis conducted on geographies consisting of 499,036,365 people shows a weak positive correlation between the proportion of Koreans and poverty level among single females in the United States with a correlation coefficient (R) of 0.240 and weighted average of 18.6%. Similarly, the statistical analysis conducted on geographies consisting of 349,903,575 people shows a weak negative correlation between the proportion of Belgians and poverty level among single females in the United States with a correlation coefficient (R) of -0.209 and weighted average of 21.5%, a difference of 15.8%.
Single Female Poverty Correlation Summary
| Measurement | Korean | Belgian |
| Minimum | 1.8% | 3.8% |
| Maximum | 56.2% | 78.0% |
| Range | 54.5% | 74.2% |
| Mean | 17.8% | 23.7% |
| Median | 16.1% | 21.2% |
| Interquartile 25% (IQ1) | 12.4% | 14.8% |
| Interquartile 75% (IQ3) | 20.2% | 31.6% |
| Interquartile Range (IQR) | 7.8% | 16.8% |
| Standard Deviation (Sample) | 9.3% | 13.9% |
| Standard Deviation (Population) | 9.3% | 13.7% |
Similar Demographics by Single Female Poverty
Demographics Similar to Koreans by Single Female Poverty
In terms of single female poverty, the demographic groups most similar to Koreans are Immigrants from Japan (18.6%, a difference of 0.060%), Immigrants from Philippines (18.6%, a difference of 0.18%), Turkish (18.7%, a difference of 0.24%), Immigrants from Sri Lanka (18.6%, a difference of 0.25%), and Immigrants from Armenia (18.7%, a difference of 0.26%).
| Demographics | Rating | Rank | Single Female Poverty |
| Immigrants | Pakistan | 100.0 /100 | #27 | Exceptional 18.4% |
| Immigrants | Moldova | 100.0 /100 | #28 | Exceptional 18.5% |
| Immigrants | Poland | 100.0 /100 | #29 | Exceptional 18.5% |
| Immigrants | North Macedonia | 99.9 /100 | #30 | Exceptional 18.5% |
| Immigrants | Asia | 99.9 /100 | #31 | Exceptional 18.6% |
| Immigrants | Sri Lanka | 99.9 /100 | #32 | Exceptional 18.6% |
| Immigrants | Philippines | 99.9 /100 | #33 | Exceptional 18.6% |
| Koreans | 99.9 /100 | #34 | Exceptional 18.6% |
| Immigrants | Japan | 99.9 /100 | #35 | Exceptional 18.6% |
| Turks | 99.9 /100 | #36 | Exceptional 18.7% |
| Immigrants | Armenia | 99.9 /100 | #37 | Exceptional 18.7% |
| Tongans | 99.9 /100 | #38 | Exceptional 18.8% |
| Bulgarians | 99.9 /100 | #39 | Exceptional 18.8% |
| Okinawans | 99.9 /100 | #40 | Exceptional 18.8% |
| Immigrants | Serbia | 99.9 /100 | #41 | Exceptional 18.8% |
Demographics Similar to Belgians by Single Female Poverty
In terms of single female poverty, the demographic groups most similar to Belgians are Finnish (21.5%, a difference of 0.020%), Ghanaian (21.6%, a difference of 0.040%), Immigrants from Africa (21.5%, a difference of 0.070%), Haitian (21.6%, a difference of 0.070%), and Immigrants from Eastern Africa (21.6%, a difference of 0.11%).
| Demographics | Rating | Rank | Single Female Poverty |
| Immigrants | Immigrants | 22.0 /100 | #199 | Fair 21.4% |
| Irish | 21.4 /100 | #200 | Fair 21.4% |
| Nigerians | 20.9 /100 | #201 | Fair 21.4% |
| Immigrants | Kenya | 20.7 /100 | #202 | Fair 21.4% |
| Immigrants | Haiti | 18.8 /100 | #203 | Poor 21.5% |
| Immigrants | Africa | 16.7 /100 | #204 | Poor 21.5% |
| Finns | 16.2 /100 | #205 | Poor 21.5% |
| Belgians | 16.1 /100 | #206 | Poor 21.5% |
| Ghanaians | 15.7 /100 | #207 | Poor 21.6% |
| Haitians | 15.4 /100 | #208 | Poor 21.6% |
| Immigrants | Eastern Africa | 15.1 /100 | #209 | Poor 21.6% |
| Immigrants | Panama | 14.4 /100 | #210 | Poor 21.6% |
| Icelanders | 14.0 /100 | #211 | Poor 21.6% |
| Jamaicans | 14.0 /100 | #212 | Poor 21.6% |
| Guamanians/Chamorros | 13.7 /100 | #213 | Poor 21.6% |