Iranian vs Immigrants from Cambodia Median Female Earnings

COMPARE

Iranian
Race
Ancestry
AfghanAfricanAlaska NativeAlaskan AthabascanAlbanianAleutAlsatianAmericanApacheArabArapahoArgentineanArmenianAssyrian/Chaldean/SyriacAustralianAustrianBahamianBangladeshiBarbadianBasqueBelgianBelizeanBermudanBhutaneseBlackfeetBolivianBrazilianBritishBritish West IndianBulgarianBurmeseCajunCambodianCanadianCape VerdeanCarpatho RusynCelticCentral AmericanCentral American IndianCherokeeCheyenneChickasawChileanChineseChippewaChoctawColombianColvilleComancheCosta RicanCreeCreekCroatianCrowCubanCypriotCzechCzechoslovakianDanishDelawareDominicanDutchDutch West IndianEastern EuropeanEcuadorianEgyptianEnglishEstonianEthiopianEuropeanFijianFilipinoFinnishFrenchFrench American IndianFrench CanadianGermanGerman RussianGhanaianGreekGuamanian/ChamorroGuatemalanGuyaneseHaitianHmongHonduranHopiHoumaHungarianIcelanderIndian (Asian)IndonesianInupiatIranianIraqiIrishIroquoisIsraeliItalianJamaicanJapaneseJordanianKenyanKiowaKoreanLaotianLatvianLebaneseLiberianLithuanianLumbeeLuxembourgerMacedonianMalaysianMalteseMarshalleseMenomineeMexicanMexican American IndianMongolianMoroccanNative HawaiianNavajoNepaleseNew ZealanderNicaraguanNigerianNorthern EuropeanNorwegianOkinawanOsageOttawaPaiutePakistaniPalestinianPanamanianParaguayanPennsylvania GermanPeruvianPimaPolishPortuguesePotawatomiPuebloPuerto RicanPuget Sound SalishRomanianRussianSalvadoranSamoanScandinavianScotch-IrishScottishSeminoleSenegaleseSerbianShoshoneSierra LeoneanSiouxSlavicSlovakSloveneSomaliSouth AfricanSouth AmericanSouth American IndianSoviet UnionSpaniardSpanishSpanish AmericanSpanish American IndianSri LankanSubsaharan AfricanSudaneseSwedishSwissSyrianTaiwaneseThaiTlingit-HaidaTohono O'OdhamTonganTrinidadian and TobagonianTsimshianTurkishU.S. Virgin IslanderUgandanUkrainianUruguayanUteVenezuelanVietnameseWelshWest IndianYakamaYaquiYugoslavianYumanYup'ikZimbabwean
Immigration
NonimmigrantsImmigrantsAfghanistanAfricaAlbaniaArgentinaArmeniaAsiaAustraliaAustriaBahamasBangladeshBarbadosBelarusBelgiumBelizeBoliviaBosnia and HerzegovinaBrazilBulgariaBurma/MyanmarCabo VerdeCameroonCanadaCaribbeanCentral AmericaChileChinaColombiaCongoCosta RicaCroatiaCubaCzechoslovakiaDenmarkDominicaDominican RepublicEastern AfricaEastern AsiaEastern EuropeEcuadorEgyptEl SalvadorEnglandEritreaEthiopiaEuropeFijiFranceGermanyGhanaGreeceGrenadaGuatemalaGuyanaHaitiHondurasHong KongHungaryIndiaIndonesiaIranIraqIrelandIsraelItalyJamaicaJapanJordanKazakhstanKenyaKoreaKuwaitLaosLatin AmericaLatviaLebanonLiberiaLithuaniaMalaysiaMexicoMicronesiaMiddle AfricaMoldovaMoroccoNepalNetherlandsNicaraguaNigeriaNorth AmericaNorth MacedoniaNorthern AfricaNorthern EuropeNorwayOceaniaPakistanPanamaPeruPhilippinesPolandPortugalRomaniaRussiaSaudi ArabiaScotlandSenegalSerbiaSierra LeoneSingaporeSomaliaSouth AfricaSouth AmericaSouth Central AsiaSouth Eastern AsiaSouthern EuropeSpainSri LankaSt. Vincent and the GrenadinesSudanSwedenSwitzerlandSyriaTaiwanThailandTrinidad and TobagoTurkeyUgandaUkraineUruguayUzbekistanVenezuelaVietnamWest IndiesWestern AfricaWestern AsiaWestern EuropeYemenZaireZimbabweAzores
Immigrants from Cambodia
Race
Ancestry
AfghanAfricanAlaska NativeAlaskan AthabascanAlbanianAleutAlsatianAmericanApacheArabArapahoArgentineanArmenianAssyrian/Chaldean/SyriacAustralianAustrianBahamianBangladeshiBarbadianBasqueBelgianBelizeanBermudanBhutaneseBlackfeetBolivianBrazilianBritishBritish West IndianBulgarianBurmeseCajunCambodianCanadianCape VerdeanCarpatho RusynCelticCentral AmericanCentral American IndianCherokeeCheyenneChickasawChileanChineseChippewaChoctawColombianColvilleComancheCosta RicanCreeCreekCroatianCrowCubanCypriotCzechCzechoslovakianDanishDelawareDominicanDutchDutch West IndianEastern EuropeanEcuadorianEgyptianEnglishEstonianEthiopianEuropeanFijianFilipinoFinnishFrenchFrench American IndianFrench CanadianGermanGerman RussianGhanaianGreekGuamanian/ChamorroGuatemalanGuyaneseHaitianHmongHonduranHopiHoumaHungarianIcelanderIndian (Asian)IndonesianInupiatIraqiIrishIroquoisIsraeliItalianJamaicanJapaneseJordanianKenyanKiowaKoreanLaotianLatvianLebaneseLiberianLithuanianLumbeeLuxembourgerMacedonianMalaysianMalteseMarshalleseMenomineeMexicanMexican American IndianMongolianMoroccanNative HawaiianNavajoNepaleseNew ZealanderNicaraguanNigerianNorthern EuropeanNorwegianOkinawanOsageOttawaPaiutePakistaniPalestinianPanamanianParaguayanPennsylvania GermanPeruvianPimaPolishPortuguesePotawatomiPuebloPuerto RicanPuget Sound SalishRomanianRussianSalvadoranSamoanScandinavianScotch-IrishScottishSeminoleSenegaleseSerbianShoshoneSierra LeoneanSiouxSlavicSlovakSloveneSomaliSouth AfricanSouth AmericanSouth American IndianSoviet UnionSpaniardSpanishSpanish AmericanSpanish American IndianSri LankanSubsaharan AfricanSudaneseSwedishSwissSyrianTaiwaneseThaiTlingit-HaidaTohono O'OdhamTonganTrinidadian and TobagonianTsimshianTurkishU.S. Virgin IslanderUgandanUkrainianUruguayanUteVenezuelanVietnameseWelshWest IndianYakamaYaquiYugoslavianYumanYup'ikZimbabwean
Immigration
NonimmigrantsImmigrantsAfghanistanAfricaAlbaniaArgentinaArmeniaAsiaAustraliaAustriaBahamasBangladeshBarbadosBelarusBelgiumBelizeBoliviaBosnia and HerzegovinaBrazilBulgariaBurma/MyanmarCabo VerdeCambodiaCameroonCanadaCaribbeanCentral AmericaChileChinaColombiaCongoCosta RicaCroatiaCubaCzechoslovakiaDenmarkDominicaDominican RepublicEastern AfricaEastern AsiaEastern EuropeEcuadorEgyptEl SalvadorEnglandEritreaEthiopiaEuropeFijiFranceGermanyGhanaGreeceGrenadaGuatemalaGuyanaHaitiHondurasHong KongHungaryIndiaIndonesiaIranIraqIrelandIsraelItalyJamaicaJapanJordanKazakhstanKenyaKoreaKuwaitLaosLatin AmericaLatviaLebanonLiberiaLithuaniaMalaysiaMexicoMicronesiaMiddle AfricaMoldovaMoroccoNepalNetherlandsNicaraguaNigeriaNorth AmericaNorth MacedoniaNorthern AfricaNorthern EuropeNorwayOceaniaPakistanPanamaPeruPhilippinesPolandPortugalRomaniaRussiaSaudi ArabiaScotlandSenegalSerbiaSierra LeoneSingaporeSomaliaSouth AfricaSouth AmericaSouth Central AsiaSouth Eastern AsiaSouthern EuropeSpainSri LankaSt. Vincent and the GrenadinesSudanSwedenSwitzerlandSyriaTaiwanThailandTrinidad and TobagoTurkeyUgandaUkraineUruguayUzbekistanVenezuelaVietnamWest IndiesWestern AfricaWestern AsiaWestern EuropeYemenZaireZimbabweAzores
Median Female Earnings
Income
Poverty
Unemployment
Labor Participation
Family Structure
Vehicle Availability
Education Level
Disability

Median Female Earnings Comparison

Iranians

Immigrants from Cambodia

Exceptional
Poor
$47,421
MEDIAN FEMALE EARNINGS
100.0/ 100
METRIC RATING
8th/ 347
METRIC RANK
$38,833
MEDIAN FEMALE EARNINGS
14.2/ 100
METRIC RATING
207th/ 347
METRIC RANK

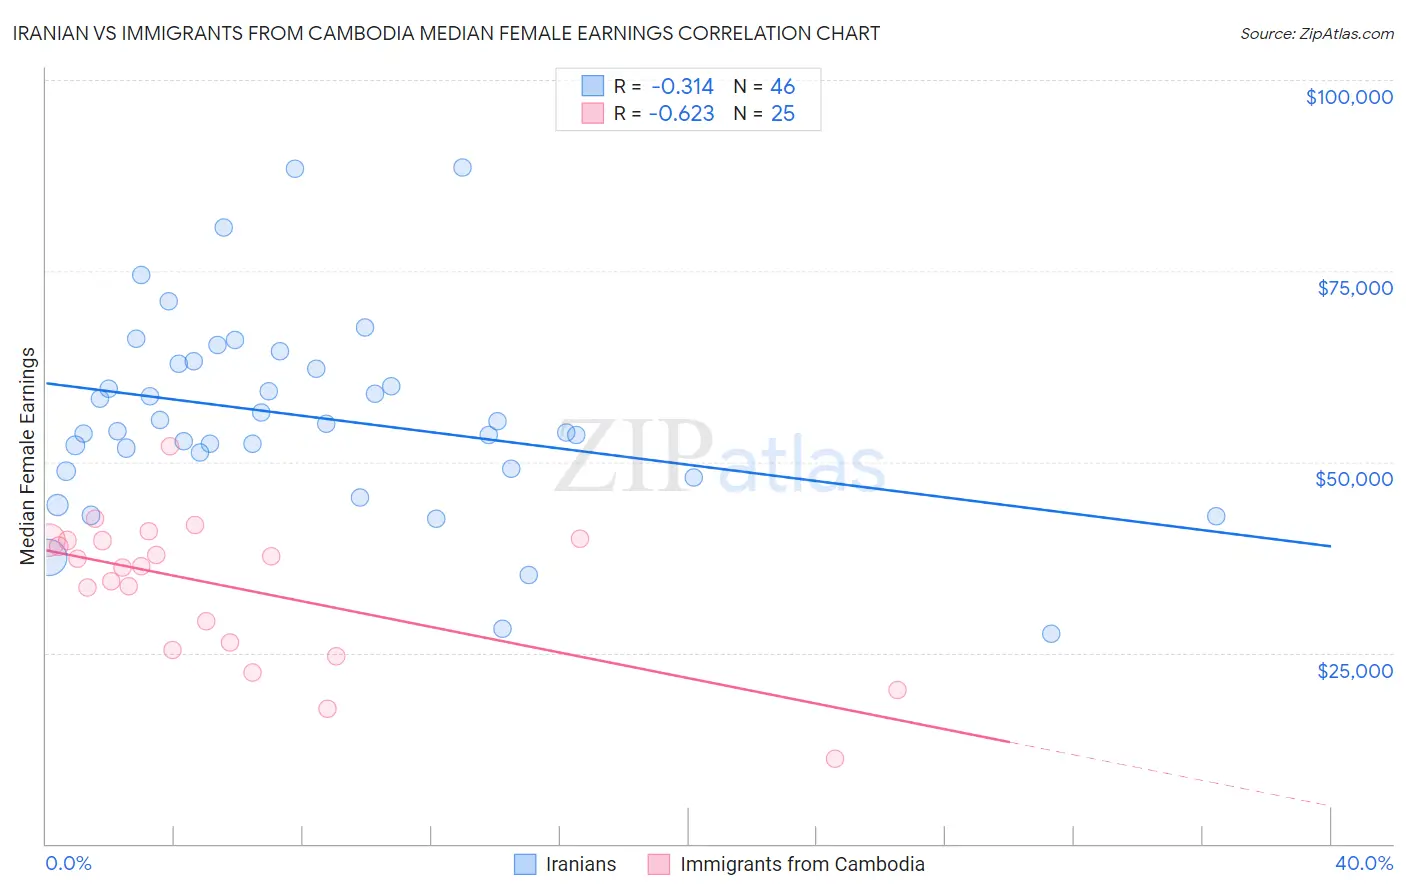
Iranian vs Immigrants from Cambodia Median Female Earnings Correlation Chart

The statistical analysis conducted on geographies consisting of 316,781,668 people shows a mild negative correlation between the proportion of Iranians and median female earnings in the United States with a correlation coefficient (R) of -0.314 and weighted average of $47,421. Similarly, the statistical analysis conducted on geographies consisting of 205,144,839 people shows a significant negative correlation between the proportion of Immigrants from Cambodia and median female earnings in the United States with a correlation coefficient (R) of -0.623 and weighted average of $38,833, a difference of 22.1%.
Iranian vs Immigrants from Cambodia Median Female Earnings

Median Female Earnings Correlation Summary

MeasurementIranianImmigrants from Cambodia
Minimum$27,465$11,066
Maximum$88,523$52,046
Range$61,058$40,980
Mean$55,900$33,558
Median$54,566$36,286
Interquartile 25% (IQ1)$49,107$25,865
Interquartile 75% (IQ3)$62,773$39,745
Interquartile Range (IQR)$13,666$13,880
Standard Deviation (Sample)$12,815$9,295
Standard Deviation (Population)$12,675$9,107

Similar Demographics by Median Female Earnings

Demographics Similar to Iranians by Median Female Earnings

In terms of median female earnings, the demographic groups most similar to Iranians are Thai ($47,577, a difference of 0.33%), Immigrants from Ireland ($47,598, a difference of 0.37%), Immigrants from Iran ($47,154, a difference of 0.57%), Immigrants from China ($46,972, a difference of 0.95%), and Okinawan ($46,905, a difference of 1.1%).
DemographicsRating | RankMedian Female Earnings
Immigrants | Hong Kong
100.0
/100
|
#1
Exceptional
$49,818
Filipinos
100.0
/100
|
#2
Exceptional
$49,508
Immigrants | Taiwan
100.0
/100
|
#3
Exceptional
$49,256
Immigrants | India
100.0
/100
|
#4
Exceptional
$48,292
Immigrants | Singapore
100.0
/100
|
#5
Exceptional
$47,986
Immigrants | Ireland
100.0
/100
|
#6
Exceptional
$47,598
Thais
100.0
/100
|
#7
Exceptional
$47,577
Iranians
100.0
/100
|
#8
Exceptional
$47,421
Immigrants | Iran
100.0
/100
|
#9
Exceptional
$47,154
Immigrants | China
100.0
/100
|
#10
Exceptional
$46,972
Okinawans
100.0
/100
|
#11
Exceptional
$46,905
Immigrants | Israel
100.0
/100
|
#12
Exceptional
$46,902
Immigrants | Australia
100.0
/100
|
#13
Exceptional
$46,573
Soviet Union
100.0
/100
|
#14
Exceptional
$46,556
Immigrants | Eastern Asia
100.0
/100
|
#15
Exceptional
$46,502

Demographics Similar to Immigrants from Cambodia by Median Female Earnings

In terms of median female earnings, the demographic groups most similar to Immigrants from Cambodia are Immigrants from Thailand ($38,810, a difference of 0.060%), Norwegian ($38,802, a difference of 0.080%), Immigrants from Bosnia and Herzegovina ($38,886, a difference of 0.14%), Immigrants from Colombia ($38,913, a difference of 0.20%), and Czechoslovakian ($38,738, a difference of 0.25%).
DemographicsRating | RankMedian Female Earnings
Immigrants | Panama
20.6
/100
|
#200
Fair
$39,049
Panamanians
20.6
/100
|
#201
Fair
$39,049
Slovaks
19.9
/100
|
#202
Poor
$39,029
Czechs
18.7
/100
|
#203
Poor
$38,992
Immigrants | Uruguay
17.3
/100
|
#204
Poor
$38,945
Immigrants | Colombia
16.3
/100
|
#205
Poor
$38,913
Immigrants | Bosnia and Herzegovina
15.6
/100
|
#206
Poor
$38,886
Immigrants | Cambodia
14.2
/100
|
#207
Poor
$38,833
Immigrants | Thailand
13.6
/100
|
#208
Poor
$38,810
Norwegians
13.4
/100
|
#209
Poor
$38,802
Czechoslovakians
12.0
/100
|
#210
Poor
$38,738
Aleuts
11.6
/100
|
#211
Poor
$38,719
Guamanians/Chamorros
11.5
/100
|
#212
Poor
$38,717
Jamaicans
10.5
/100
|
#213
Poor
$38,670
Iraqis
10.5
/100
|
#214
Poor
$38,666