South American Indian vs Immigrants from Cambodia Single Mother Poverty
COMPARE
South American Indian
Immigrants from Cambodia
Single Mother Poverty
Single Mother Poverty Comparison
South American Indians
Immigrants from Cambodia
29.3%
SINGLE MOTHER POVERTY
43.2/ 100
METRIC RATING
178th/ 347
METRIC RANK
28.9%
SINGLE MOTHER POVERTY
66.6/ 100
METRIC RATING
161st/ 347
METRIC RANK
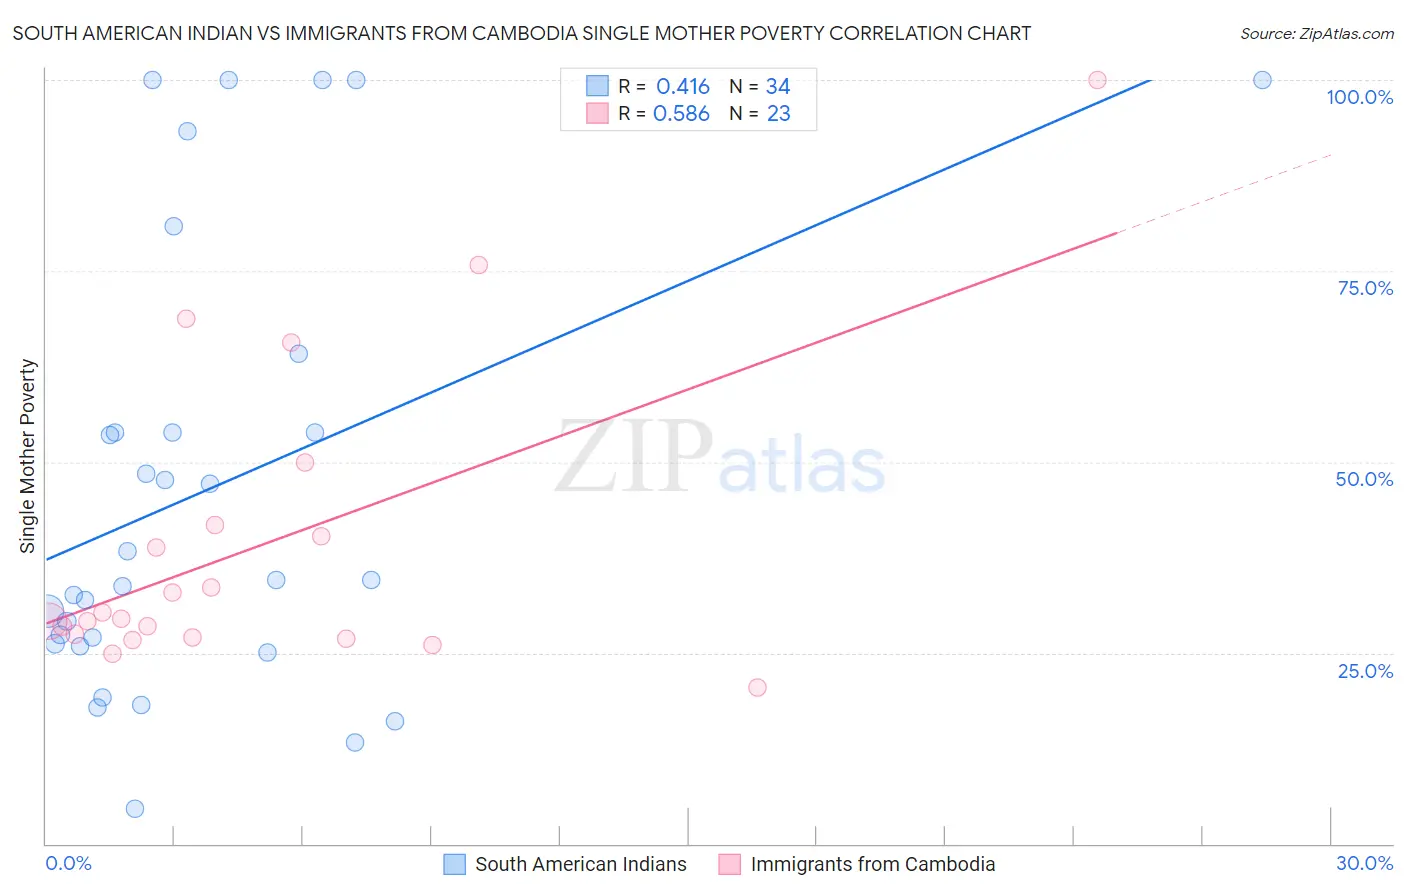
South American Indian vs Immigrants from Cambodia Single Mother Poverty Correlation Chart
The statistical analysis conducted on geographies consisting of 163,070,605 people shows a moderate positive correlation between the proportion of South American Indians and poverty level among single mothers in the United States with a correlation coefficient (R) of 0.416 and weighted average of 29.3%. Similarly, the statistical analysis conducted on geographies consisting of 203,469,130 people shows a substantial positive correlation between the proportion of Immigrants from Cambodia and poverty level among single mothers in the United States with a correlation coefficient (R) of 0.586 and weighted average of 28.9%, a difference of 1.2%.
Single Mother Poverty Correlation Summary
| Measurement | South American Indian | Immigrants from Cambodia |
| Minimum | 4.7% | 20.4% |
| Maximum | 100.0% | 100.0% |
| Range | 95.3% | 79.6% |
| Mean | 46.5% | 39.2% |
| Median | 34.5% | 29.5% |
| Interquartile 25% (IQ1) | 26.2% | 27.0% |
| Interquartile 75% (IQ3) | 53.9% | 41.7% |
| Interquartile Range (IQR) | 27.7% | 14.7% |
| Standard Deviation (Sample) | 29.1% | 19.9% |
| Standard Deviation (Population) | 28.6% | 19.5% |
Demographics Similar to South American Indians and Immigrants from Cambodia by Single Mother Poverty
In terms of single mother poverty, the demographic groups most similar to South American Indians are Immigrants from Uzbekistan (29.3%, a difference of 0.030%), Immigrants from Bosnia and Herzegovina (29.2%, a difference of 0.090%), Hawaiian (29.2%, a difference of 0.22%), Immigrants from Costa Rica (29.2%, a difference of 0.27%), and Immigrants from Saudi Arabia (29.2%, a difference of 0.32%). Similarly, the demographic groups most similar to Immigrants from Cambodia are Scandinavian (28.9%, a difference of 0.020%), Immigrants from Nigeria (28.9%, a difference of 0.040%), Immigrants from Kenya (28.9%, a difference of 0.040%), Japanese (28.9%, a difference of 0.080%), and Czech (28.9%, a difference of 0.10%).
| Demographics | Rating | Rank | Single Mother Poverty |
| Czechs | 68.4 /100 | #159 | Good 28.9% |
| Japanese | 68.0 /100 | #160 | Good 28.9% |
| Immigrants | Cambodia | 66.6 /100 | #161 | Good 28.9% |
| Scandinavians | 66.2 /100 | #162 | Good 28.9% |
| Immigrants | Nigeria | 65.9 /100 | #163 | Good 28.9% |
| Immigrants | Kenya | 65.9 /100 | #164 | Good 28.9% |
| Arabs | 60.7 /100 | #165 | Good 29.0% |
| Inupiat | 60.4 /100 | #166 | Good 29.0% |
| Costa Ricans | 58.4 /100 | #167 | Average 29.0% |
| Europeans | 57.6 /100 | #168 | Average 29.1% |
| Immigrants | Uruguay | 57.2 /100 | #169 | Average 29.1% |
| New Zealanders | 55.1 /100 | #170 | Average 29.1% |
| Puget Sound Salish | 55.1 /100 | #171 | Average 29.1% |
| Carpatho Rusyns | 53.8 /100 | #172 | Average 29.1% |
| British | 50.6 /100 | #173 | Average 29.2% |
| Immigrants | Saudi Arabia | 50.0 /100 | #174 | Average 29.2% |
| Immigrants | Costa Rica | 48.8 /100 | #175 | Average 29.2% |
| Hawaiians | 47.8 /100 | #176 | Average 29.2% |
| Immigrants | Bosnia and Herzegovina | 45.1 /100 | #177 | Average 29.2% |
| South American Indians | 43.2 /100 | #178 | Average 29.3% |
| Immigrants | Uzbekistan | 42.6 /100 | #179 | Average 29.3% |