Alaskan Athabascan vs Immigrants from Cambodia Single Mother Poverty
COMPARE
Alaskan Athabascan
Immigrants from Cambodia
Single Mother Poverty
Single Mother Poverty Comparison
Alaskan Athabascans
Immigrants from Cambodia
30.3%
SINGLE MOTHER POVERTY
4.1/ 100
METRIC RATING
232nd/ 347
METRIC RANK
28.9%
SINGLE MOTHER POVERTY
66.6/ 100
METRIC RATING
161st/ 347
METRIC RANK
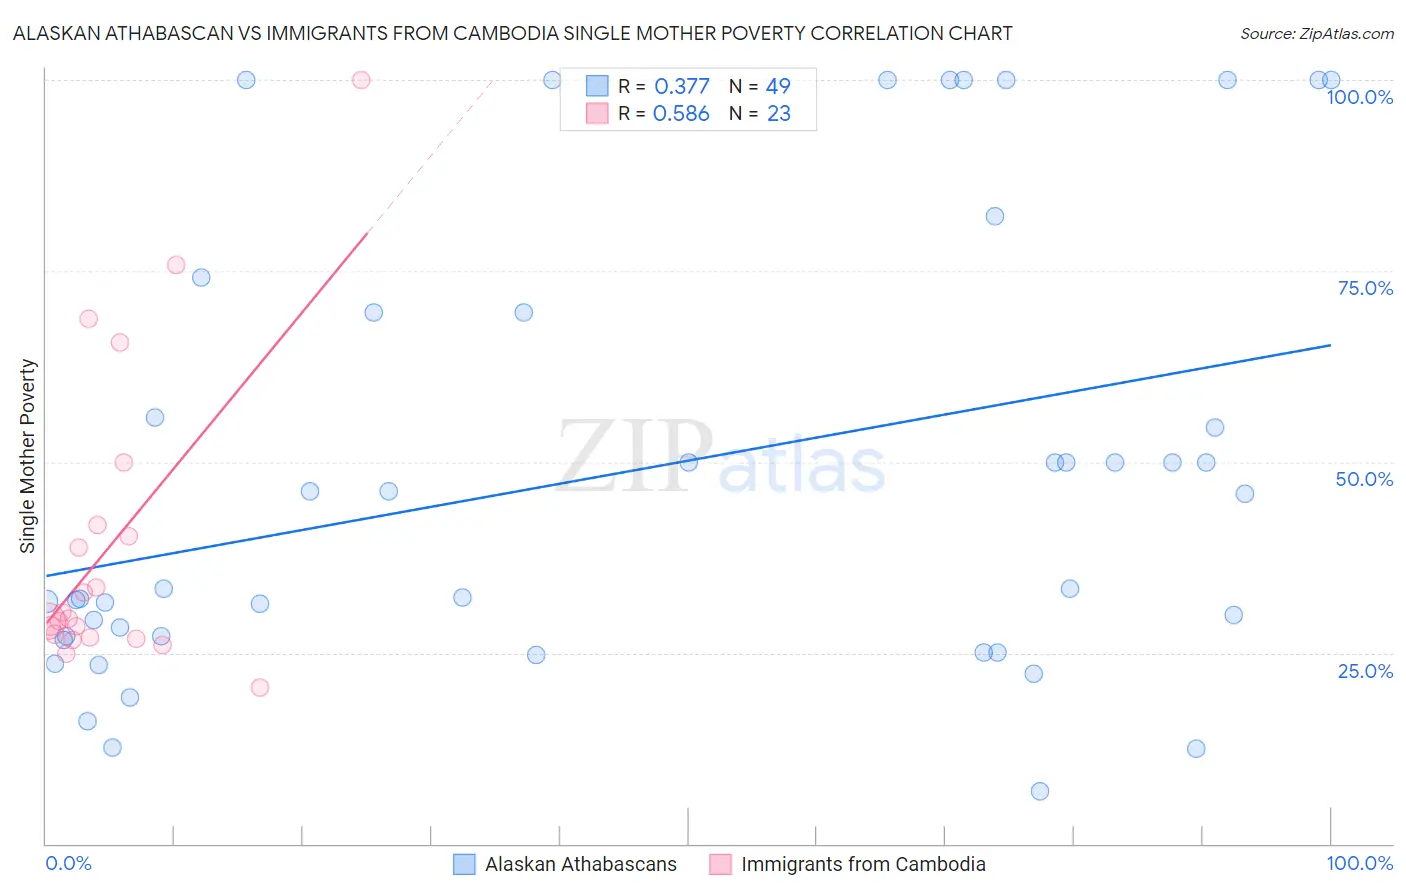
Alaskan Athabascan vs Immigrants from Cambodia Single Mother Poverty Correlation Chart
The statistical analysis conducted on geographies consisting of 45,529,547 people shows a mild positive correlation between the proportion of Alaskan Athabascans and poverty level among single mothers in the United States with a correlation coefficient (R) of 0.377 and weighted average of 30.3%. Similarly, the statistical analysis conducted on geographies consisting of 203,469,130 people shows a substantial positive correlation between the proportion of Immigrants from Cambodia and poverty level among single mothers in the United States with a correlation coefficient (R) of 0.586 and weighted average of 28.9%, a difference of 4.6%.
Single Mother Poverty Correlation Summary
| Measurement | Alaskan Athabascan | Immigrants from Cambodia |
| Minimum | 6.8% | 20.4% |
| Maximum | 100.0% | 100.0% |
| Range | 93.2% | 79.6% |
| Mean | 48.6% | 39.2% |
| Median | 33.3% | 29.5% |
| Interquartile 25% (IQ1) | 26.9% | 27.0% |
| Interquartile 75% (IQ3) | 69.6% | 41.7% |
| Interquartile Range (IQR) | 42.6% | 14.7% |
| Standard Deviation (Sample) | 29.3% | 19.9% |
| Standard Deviation (Population) | 29.0% | 19.5% |
Similar Demographics by Single Mother Poverty
Demographics Similar to Alaskan Athabascans by Single Mother Poverty
In terms of single mother poverty, the demographic groups most similar to Alaskan Athabascans are Dutch (30.2%, a difference of 0.040%), English (30.2%, a difference of 0.19%), Immigrants from Middle Africa (30.3%, a difference of 0.21%), Immigrants from Nicaragua (30.3%, a difference of 0.22%), and Immigrants from Barbados (30.2%, a difference of 0.23%).
| Demographics | Rating | Rank | Single Mother Poverty |
| Spanish | 6.3 /100 | #225 | Tragic 30.1% |
| Scottish | 6.0 /100 | #226 | Tragic 30.1% |
| Immigrants | Liberia | 5.9 /100 | #227 | Tragic 30.1% |
| Spaniards | 5.4 /100 | #228 | Tragic 30.2% |
| Immigrants | Barbados | 5.0 /100 | #229 | Tragic 30.2% |
| English | 4.8 /100 | #230 | Tragic 30.2% |
| Dutch | 4.3 /100 | #231 | Tragic 30.2% |
| Alaskan Athabascans | 4.1 /100 | #232 | Tragic 30.3% |
| Immigrants | Middle Africa | 3.5 /100 | #233 | Tragic 30.3% |
| Immigrants | Nicaragua | 3.5 /100 | #234 | Tragic 30.3% |
| Immigrants | Grenada | 3.4 /100 | #235 | Tragic 30.3% |
| Welsh | 3.2 /100 | #236 | Tragic 30.4% |
| Immigrants | St. Vincent and the Grenadines | 3.1 /100 | #237 | Tragic 30.4% |
| Slovaks | 2.8 /100 | #238 | Tragic 30.4% |
| Immigrants | Portugal | 2.1 /100 | #239 | Tragic 30.5% |
Demographics Similar to Immigrants from Cambodia by Single Mother Poverty
In terms of single mother poverty, the demographic groups most similar to Immigrants from Cambodia are Scandinavian (28.9%, a difference of 0.020%), Immigrants from Nigeria (28.9%, a difference of 0.040%), Immigrants from Kenya (28.9%, a difference of 0.040%), Japanese (28.9%, a difference of 0.080%), and Czech (28.9%, a difference of 0.10%).
| Demographics | Rating | Rank | Single Mother Poverty |
| Portuguese | 73.2 /100 | #154 | Good 28.8% |
| Ugandans | 71.7 /100 | #155 | Good 28.8% |
| Iraqis | 71.5 /100 | #156 | Good 28.8% |
| Immigrants | Western Europe | 71.1 /100 | #157 | Good 28.9% |
| Immigrants | Hungary | 70.6 /100 | #158 | Good 28.9% |
| Czechs | 68.4 /100 | #159 | Good 28.9% |
| Japanese | 68.0 /100 | #160 | Good 28.9% |
| Immigrants | Cambodia | 66.6 /100 | #161 | Good 28.9% |
| Scandinavians | 66.2 /100 | #162 | Good 28.9% |
| Immigrants | Nigeria | 65.9 /100 | #163 | Good 28.9% |
| Immigrants | Kenya | 65.9 /100 | #164 | Good 28.9% |
| Arabs | 60.7 /100 | #165 | Good 29.0% |
| Inupiat | 60.4 /100 | #166 | Good 29.0% |
| Costa Ricans | 58.4 /100 | #167 | Average 29.0% |
| Europeans | 57.6 /100 | #168 | Average 29.1% |