Iranian vs Immigrants from Cambodia No Schooling Completed
COMPARE
Iranian
Immigrants from Cambodia
No Schooling Completed
No Schooling Completed Comparison
Iranians
Immigrants from Cambodia
1.8%
NO SCHOOLING COMPLETED
98.2/ 100
METRIC RATING
98th/ 347
METRIC RANK
3.5%
NO SCHOOLING COMPLETED
0.0/ 100
METRIC RATING
335th/ 347
METRIC RANK
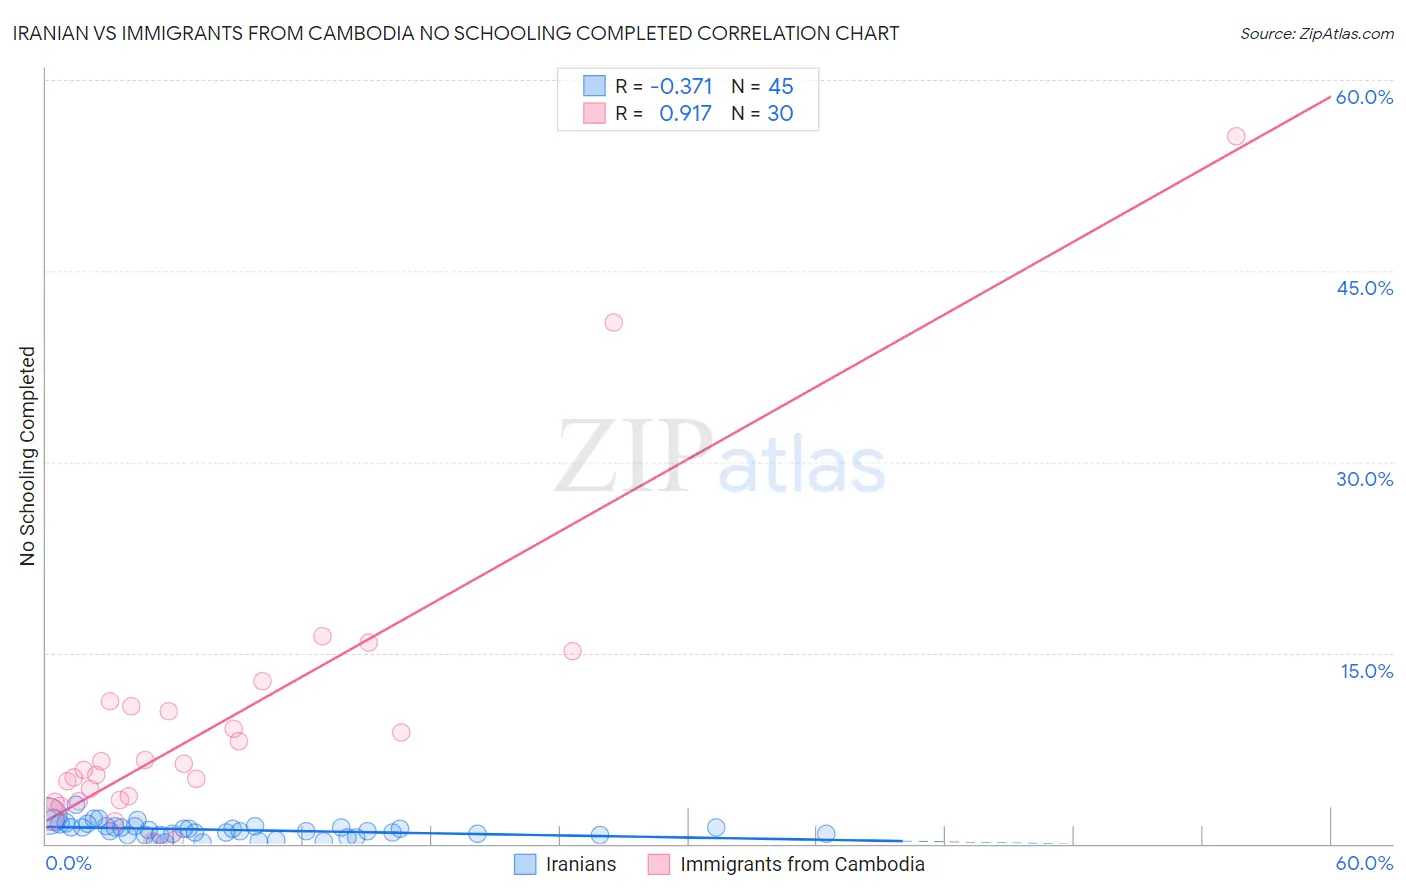
Iranian vs Immigrants from Cambodia No Schooling Completed Correlation Chart
The statistical analysis conducted on geographies consisting of 314,406,519 people shows a mild negative correlation between the proportion of Iranians and percentage of population with no schooling in the United States with a correlation coefficient (R) of -0.371 and weighted average of 1.8%. Similarly, the statistical analysis conducted on geographies consisting of 204,723,315 people shows a near-perfect positive correlation between the proportion of Immigrants from Cambodia and percentage of population with no schooling in the United States with a correlation coefficient (R) of 0.917 and weighted average of 3.5%, a difference of 93.2%.
No Schooling Completed Correlation Summary
| Measurement | Iranian | Immigrants from Cambodia |
| Minimum | 0.093% | 0.15% |
| Maximum | 3.1% | 55.6% |
| Range | 3.0% | 55.4% |
| Mean | 1.1% | 9.5% |
| Median | 1.1% | 6.0% |
| Interquartile 25% (IQ1) | 0.72% | 3.4% |
| Interquartile 75% (IQ3) | 1.4% | 10.8% |
| Interquartile Range (IQR) | 0.65% | 7.4% |
| Standard Deviation (Sample) | 0.60% | 11.5% |
| Standard Deviation (Population) | 0.60% | 11.4% |
Similar Demographics by No Schooling Completed
Demographics Similar to Iranians by No Schooling Completed
In terms of no schooling completed, the demographic groups most similar to Iranians are Choctaw (1.8%, a difference of 0.19%), Immigrants from Ireland (1.8%, a difference of 0.28%), Immigrants from Singapore (1.8%, a difference of 0.39%), Bhutanese (1.8%, a difference of 0.46%), and Immigrants from Czechoslovakia (1.8%, a difference of 0.68%).
| Demographics | Rating | Rank | No Schooling Completed |
| Immigrants | Germany | 99.0 /100 | #91 | Exceptional 1.8% |
| Romanians | 98.8 /100 | #92 | Exceptional 1.8% |
| Turks | 98.7 /100 | #93 | Exceptional 1.8% |
| Immigrants | Nonimmigrants | 98.5 /100 | #94 | Exceptional 1.8% |
| Puget Sound Salish | 98.5 /100 | #95 | Exceptional 1.8% |
| Bhutanese | 98.4 /100 | #96 | Exceptional 1.8% |
| Immigrants | Ireland | 98.4 /100 | #97 | Exceptional 1.8% |
| Iranians | 98.2 /100 | #98 | Exceptional 1.8% |
| Choctaw | 98.1 /100 | #99 | Exceptional 1.8% |
| Immigrants | Singapore | 98.0 /100 | #100 | Exceptional 1.8% |
| Immigrants | Czechoslovakia | 97.9 /100 | #101 | Exceptional 1.8% |
| Immigrants | Switzerland | 97.9 /100 | #102 | Exceptional 1.8% |
| Basques | 97.9 /100 | #103 | Exceptional 1.8% |
| Thais | 97.5 /100 | #104 | Exceptional 1.8% |
| German Russians | 97.5 /100 | #105 | Exceptional 1.8% |
Demographics Similar to Immigrants from Cambodia by No Schooling Completed
In terms of no schooling completed, the demographic groups most similar to Immigrants from Cambodia are Immigrants from Fiji (3.5%, a difference of 0.37%), Guatemalan (3.5%, a difference of 1.0%), Immigrants from Cabo Verde (3.5%, a difference of 1.1%), Bangladeshi (3.5%, a difference of 1.3%), and Yakama (3.6%, a difference of 1.6%).
| Demographics | Rating | Rank | No Schooling Completed |
| Mexicans | 0.0 /100 | #328 | Tragic 3.3% |
| Immigrants | Vietnam | 0.0 /100 | #329 | Tragic 3.3% |
| Immigrants | Armenia | 0.0 /100 | #330 | Tragic 3.3% |
| Japanese | 0.0 /100 | #331 | Tragic 3.3% |
| Central Americans | 0.0 /100 | #332 | Tragic 3.4% |
| Immigrants | Dominican Republic | 0.0 /100 | #333 | Tragic 3.4% |
| Guatemalans | 0.0 /100 | #334 | Tragic 3.5% |
| Immigrants | Cambodia | 0.0 /100 | #335 | Tragic 3.5% |
| Immigrants | Fiji | 0.0 /100 | #336 | Tragic 3.5% |
| Immigrants | Cabo Verde | 0.0 /100 | #337 | Tragic 3.5% |
| Bangladeshis | 0.0 /100 | #338 | Tragic 3.5% |
| Yakama | 0.0 /100 | #339 | Tragic 3.6% |
| Immigrants | Guatemala | 0.0 /100 | #340 | Tragic 3.6% |
| Immigrants | Central America | 0.0 /100 | #341 | Tragic 3.6% |
| Immigrants | Mexico | 0.0 /100 | #342 | Tragic 3.6% |