Indonesian vs Houma Single Male Poverty
COMPARE
Indonesian
Houma
Single Male Poverty
Single Male Poverty Comparison
Indonesians
Houma
14.1%
SINGLE MALE POVERTY
0.0/ 100
METRIC RATING
279th/ 347
METRIC RANK
23.5%
SINGLE MALE POVERTY
0.0/ 100
METRIC RATING
342nd/ 347
METRIC RANK
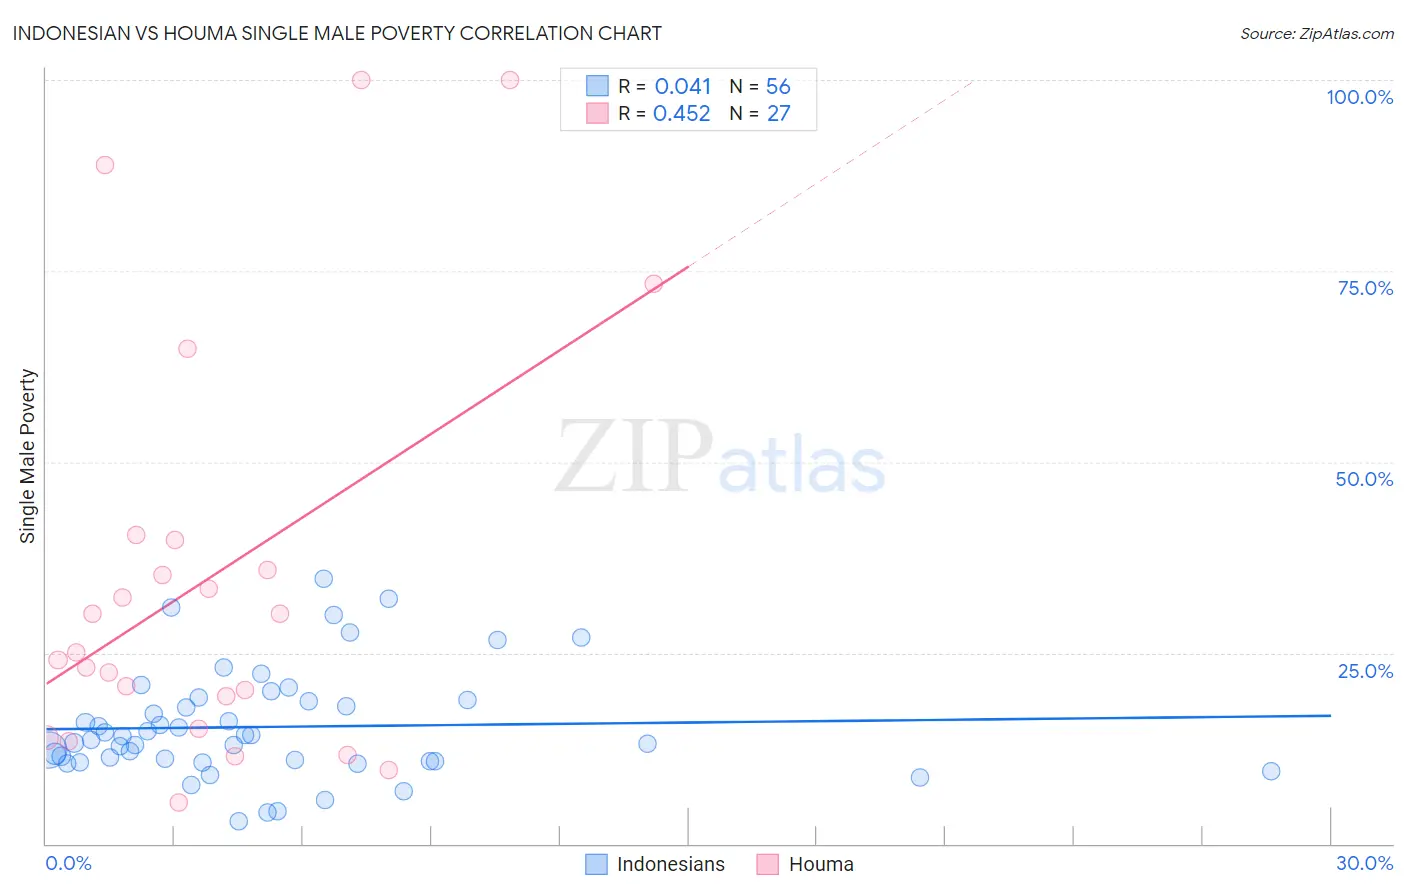
Indonesian vs Houma Single Male Poverty Correlation Chart
The statistical analysis conducted on geographies consisting of 153,765,867 people shows no correlation between the proportion of Indonesians and poverty level among single males in the United States with a correlation coefficient (R) of 0.041 and weighted average of 14.1%. Similarly, the statistical analysis conducted on geographies consisting of 35,894,228 people shows a moderate positive correlation between the proportion of Houma and poverty level among single males in the United States with a correlation coefficient (R) of 0.452 and weighted average of 23.5%, a difference of 66.4%.
Single Male Poverty Correlation Summary
| Measurement | Indonesian | Houma |
| Minimum | 2.9% | 5.4% |
| Maximum | 34.7% | 100.0% |
| Range | 31.8% | 94.6% |
| Mean | 15.3% | 34.8% |
| Median | 13.9% | 25.0% |
| Interquartile 25% (IQ1) | 10.8% | 15.1% |
| Interquartile 75% (IQ3) | 18.8% | 39.7% |
| Interquartile Range (IQR) | 8.0% | 24.7% |
| Standard Deviation (Sample) | 7.1% | 27.0% |
| Standard Deviation (Population) | 7.1% | 26.5% |
Similar Demographics by Single Male Poverty
Demographics Similar to Indonesians by Single Male Poverty
In terms of single male poverty, the demographic groups most similar to Indonesians are Slovak (14.1%, a difference of 0.040%), Immigrants from Honduras (14.1%, a difference of 0.10%), Dutch (14.1%, a difference of 0.14%), English (14.1%, a difference of 0.26%), and Honduran (14.0%, a difference of 0.34%).
| Demographics | Rating | Rank | Single Male Poverty |
| Mexicans | 0.1 /100 | #272 | Tragic 14.0% |
| Welsh | 0.1 /100 | #273 | Tragic 14.0% |
| Hondurans | 0.1 /100 | #274 | Tragic 14.0% |
| English | 0.1 /100 | #275 | Tragic 14.1% |
| Dutch | 0.1 /100 | #276 | Tragic 14.1% |
| Immigrants | Honduras | 0.0 /100 | #277 | Tragic 14.1% |
| Slovaks | 0.0 /100 | #278 | Tragic 14.1% |
| Indonesians | 0.0 /100 | #279 | Tragic 14.1% |
| Hmong | 0.0 /100 | #280 | Tragic 14.2% |
| Hispanics or Latinos | 0.0 /100 | #281 | Tragic 14.2% |
| Spanish Americans | 0.0 /100 | #282 | Tragic 14.2% |
| Yaqui | 0.0 /100 | #283 | Tragic 14.2% |
| Immigrants | Bahamas | 0.0 /100 | #284 | Tragic 14.4% |
| French | 0.0 /100 | #285 | Tragic 14.4% |
| Celtics | 0.0 /100 | #286 | Tragic 14.5% |
Demographics Similar to Houma by Single Male Poverty
In terms of single male poverty, the demographic groups most similar to Houma are Crow (23.3%, a difference of 0.82%), Sioux (22.2%, a difference of 5.6%), Arapaho (21.9%, a difference of 6.9%), Puerto Rican (25.1%, a difference of 6.9%), and Lumbee (25.2%, a difference of 7.3%).
| Demographics | Rating | Rank | Single Male Poverty |
| Inupiat | 0.0 /100 | #333 | Tragic 20.0% |
| Pima | 0.0 /100 | #334 | Tragic 20.2% |
| Yuman | 0.0 /100 | #335 | Tragic 21.3% |
| Tohono O'odham | 0.0 /100 | #336 | Tragic 21.6% |
| Apache | 0.0 /100 | #337 | Tragic 21.6% |
| Pueblo | 0.0 /100 | #338 | Tragic 21.6% |
| Arapaho | 0.0 /100 | #339 | Tragic 21.9% |
| Sioux | 0.0 /100 | #340 | Tragic 22.2% |
| Crow | 0.0 /100 | #341 | Tragic 23.3% |
| Houma | 0.0 /100 | #342 | Tragic 23.5% |
| Puerto Ricans | 0.0 /100 | #343 | Tragic 25.1% |
| Lumbee | 0.0 /100 | #344 | Tragic 25.2% |
| Navajo | 0.0 /100 | #345 | Tragic 25.3% |
| Hopi | 0.0 /100 | #346 | Tragic 27.5% |
| Yup'ik | 0.0 /100 | #347 | Tragic 31.6% |