Indonesian vs Bahamian Single Male Poverty
COMPARE
Indonesian
Bahamian
Single Male Poverty
Single Male Poverty Comparison
Indonesians
Bahamians
14.1%
SINGLE MALE POVERTY
0.0/ 100
METRIC RATING
279th/ 347
METRIC RANK
14.6%
SINGLE MALE POVERTY
0.0/ 100
METRIC RATING
291st/ 347
METRIC RANK
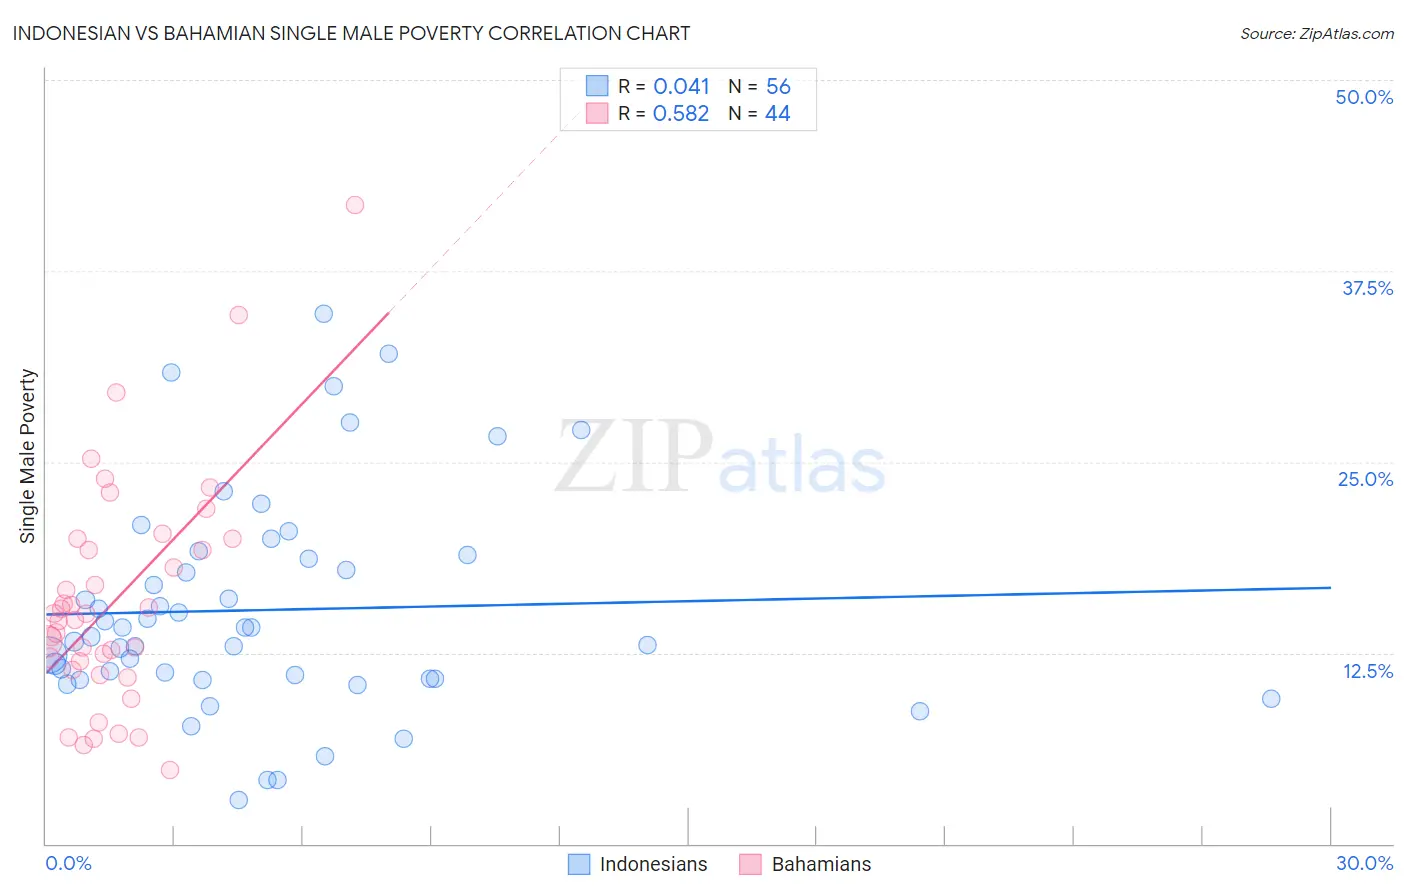
Indonesian vs Bahamian Single Male Poverty Correlation Chart
The statistical analysis conducted on geographies consisting of 153,765,867 people shows no correlation between the proportion of Indonesians and poverty level among single males in the United States with a correlation coefficient (R) of 0.041 and weighted average of 14.1%. Similarly, the statistical analysis conducted on geographies consisting of 108,151,039 people shows a substantial positive correlation between the proportion of Bahamians and poverty level among single males in the United States with a correlation coefficient (R) of 0.582 and weighted average of 14.6%, a difference of 3.2%.
Single Male Poverty Correlation Summary
| Measurement | Indonesian | Bahamian |
| Minimum | 2.9% | 4.8% |
| Maximum | 34.7% | 41.8% |
| Range | 31.8% | 37.0% |
| Mean | 15.3% | 15.9% |
| Median | 13.9% | 14.8% |
| Interquartile 25% (IQ1) | 10.8% | 11.7% |
| Interquartile 75% (IQ3) | 18.8% | 19.6% |
| Interquartile Range (IQR) | 8.0% | 7.9% |
| Standard Deviation (Sample) | 7.1% | 7.4% |
| Standard Deviation (Population) | 7.1% | 7.4% |
Demographics Similar to Indonesians and Bahamians by Single Male Poverty
In terms of single male poverty, the demographic groups most similar to Indonesians are Slovak (14.1%, a difference of 0.040%), Immigrants from Honduras (14.1%, a difference of 0.10%), Dutch (14.1%, a difference of 0.14%), English (14.1%, a difference of 0.26%), and Hmong (14.2%, a difference of 0.70%). Similarly, the demographic groups most similar to Bahamians are Nonimmigrants (14.6%, a difference of 0.13%), U.S. Virgin Islander (14.5%, a difference of 0.15%), French Canadian (14.6%, a difference of 0.25%), Immigrants from Dominica (14.5%, a difference of 0.38%), and Ottawa (14.6%, a difference of 0.43%).
| Demographics | Rating | Rank | Single Male Poverty |
| English | 0.1 /100 | #275 | Tragic 14.1% |
| Dutch | 0.1 /100 | #276 | Tragic 14.1% |
| Immigrants | Honduras | 0.0 /100 | #277 | Tragic 14.1% |
| Slovaks | 0.0 /100 | #278 | Tragic 14.1% |
| Indonesians | 0.0 /100 | #279 | Tragic 14.1% |
| Hmong | 0.0 /100 | #280 | Tragic 14.2% |
| Hispanics or Latinos | 0.0 /100 | #281 | Tragic 14.2% |
| Spanish Americans | 0.0 /100 | #282 | Tragic 14.2% |
| Yaqui | 0.0 /100 | #283 | Tragic 14.2% |
| Immigrants | Bahamas | 0.0 /100 | #284 | Tragic 14.4% |
| French | 0.0 /100 | #285 | Tragic 14.4% |
| Celtics | 0.0 /100 | #286 | Tragic 14.5% |
| Iroquois | 0.0 /100 | #287 | Tragic 14.5% |
| Whites/Caucasians | 0.0 /100 | #288 | Tragic 14.5% |
| Immigrants | Dominica | 0.0 /100 | #289 | Tragic 14.5% |
| U.S. Virgin Islanders | 0.0 /100 | #290 | Tragic 14.5% |
| Bahamians | 0.0 /100 | #291 | Tragic 14.6% |
| Immigrants | Nonimmigrants | 0.0 /100 | #292 | Tragic 14.6% |
| French Canadians | 0.0 /100 | #293 | Tragic 14.6% |
| Ottawa | 0.0 /100 | #294 | Tragic 14.6% |
| Scotch-Irish | 0.0 /100 | #295 | Tragic 14.7% |