Indonesian vs Filipino Single Male Poverty
COMPARE
Indonesian
Filipino
Single Male Poverty
Single Male Poverty Comparison
Indonesians
Filipinos
14.1%
SINGLE MALE POVERTY
0.0/ 100
METRIC RATING
279th/ 347
METRIC RANK
10.6%
SINGLE MALE POVERTY
100.0/ 100
METRIC RATING
6th/ 347
METRIC RANK
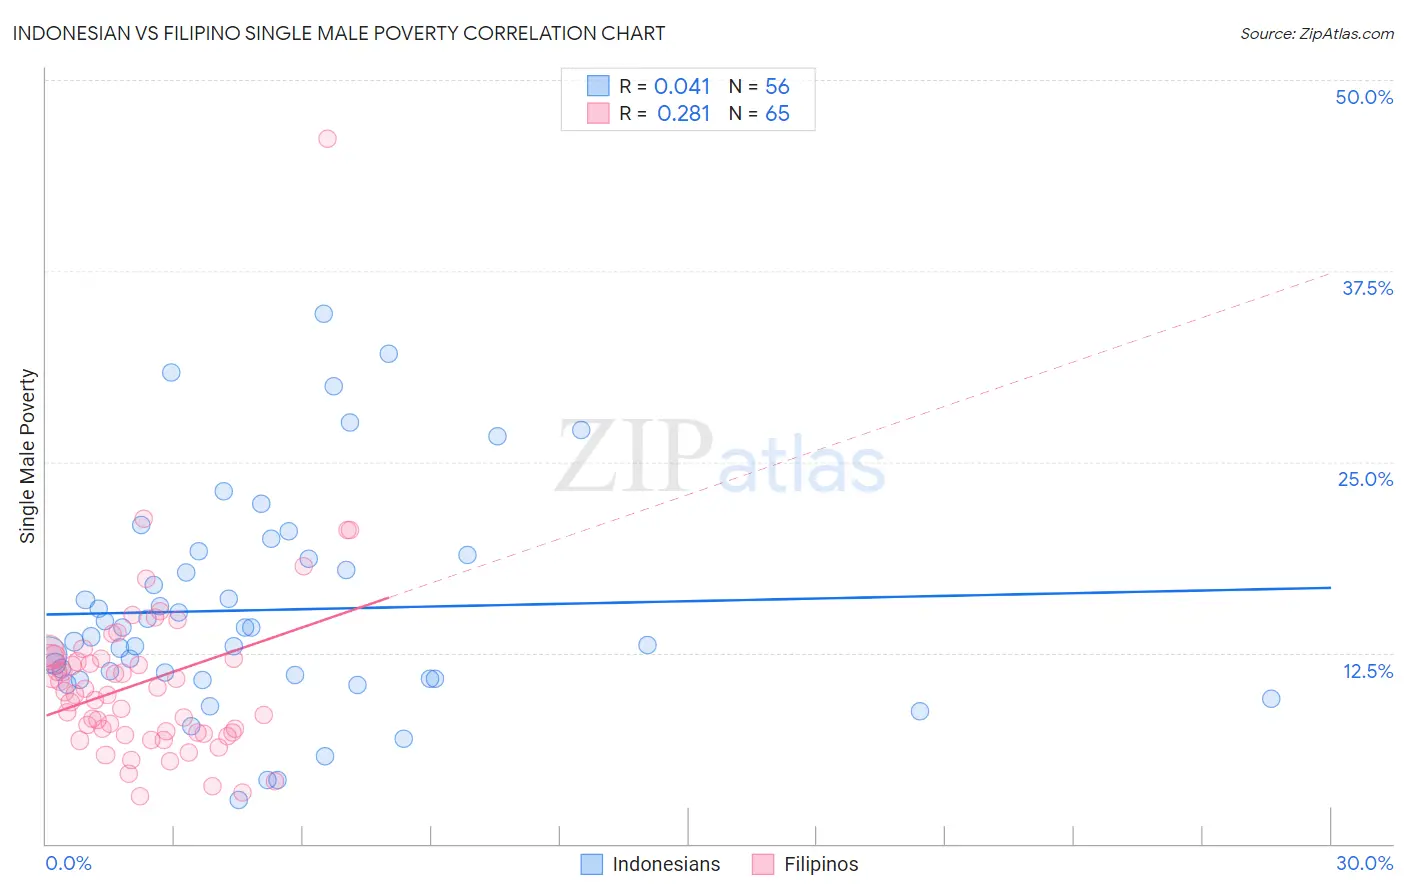
Indonesian vs Filipino Single Male Poverty Correlation Chart
The statistical analysis conducted on geographies consisting of 153,765,867 people shows no correlation between the proportion of Indonesians and poverty level among single males in the United States with a correlation coefficient (R) of 0.041 and weighted average of 14.1%. Similarly, the statistical analysis conducted on geographies consisting of 229,961,991 people shows a weak positive correlation between the proportion of Filipinos and poverty level among single males in the United States with a correlation coefficient (R) of 0.281 and weighted average of 10.6%, a difference of 32.7%.
Single Male Poverty Correlation Summary
| Measurement | Indonesian | Filipino |
| Minimum | 2.9% | 3.1% |
| Maximum | 34.7% | 46.2% |
| Range | 31.8% | 43.1% |
| Mean | 15.3% | 10.6% |
| Median | 13.9% | 9.8% |
| Interquartile 25% (IQ1) | 10.8% | 7.2% |
| Interquartile 75% (IQ3) | 18.8% | 12.2% |
| Interquartile Range (IQR) | 8.0% | 4.9% |
| Standard Deviation (Sample) | 7.1% | 6.0% |
| Standard Deviation (Population) | 7.1% | 6.0% |
Similar Demographics by Single Male Poverty
Demographics Similar to Indonesians by Single Male Poverty
In terms of single male poverty, the demographic groups most similar to Indonesians are Slovak (14.1%, a difference of 0.040%), Immigrants from Honduras (14.1%, a difference of 0.10%), Dutch (14.1%, a difference of 0.14%), English (14.1%, a difference of 0.26%), and Honduran (14.0%, a difference of 0.34%).
| Demographics | Rating | Rank | Single Male Poverty |
| Mexicans | 0.1 /100 | #272 | Tragic 14.0% |
| Welsh | 0.1 /100 | #273 | Tragic 14.0% |
| Hondurans | 0.1 /100 | #274 | Tragic 14.0% |
| English | 0.1 /100 | #275 | Tragic 14.1% |
| Dutch | 0.1 /100 | #276 | Tragic 14.1% |
| Immigrants | Honduras | 0.0 /100 | #277 | Tragic 14.1% |
| Slovaks | 0.0 /100 | #278 | Tragic 14.1% |
| Indonesians | 0.0 /100 | #279 | Tragic 14.1% |
| Hmong | 0.0 /100 | #280 | Tragic 14.2% |
| Hispanics or Latinos | 0.0 /100 | #281 | Tragic 14.2% |
| Spanish Americans | 0.0 /100 | #282 | Tragic 14.2% |
| Yaqui | 0.0 /100 | #283 | Tragic 14.2% |
| Immigrants | Bahamas | 0.0 /100 | #284 | Tragic 14.4% |
| French | 0.0 /100 | #285 | Tragic 14.4% |
| Celtics | 0.0 /100 | #286 | Tragic 14.5% |
Demographics Similar to Filipinos by Single Male Poverty
In terms of single male poverty, the demographic groups most similar to Filipinos are Afghan (10.7%, a difference of 0.75%), Thai (10.8%, a difference of 1.2%), Tongan (10.5%, a difference of 1.7%), Immigrants from Hong Kong (10.4%, a difference of 1.7%), and Taiwanese (10.9%, a difference of 2.5%).
| Demographics | Rating | Rank | Single Male Poverty |
| Assyrians/Chaldeans/Syriacs | 100.0 /100 | #1 | Exceptional 9.8% |
| Immigrants | Taiwan | 100.0 /100 | #2 | Exceptional 10.3% |
| Immigrants | India | 100.0 /100 | #3 | Exceptional 10.3% |
| Immigrants | Hong Kong | 100.0 /100 | #4 | Exceptional 10.4% |
| Tongans | 100.0 /100 | #5 | Exceptional 10.5% |
| Filipinos | 100.0 /100 | #6 | Exceptional 10.6% |
| Afghans | 100.0 /100 | #7 | Exceptional 10.7% |
| Thais | 100.0 /100 | #8 | Exceptional 10.8% |
| Taiwanese | 100.0 /100 | #9 | Exceptional 10.9% |
| Immigrants | Fiji | 100.0 /100 | #10 | Exceptional 10.9% |
| Immigrants | Philippines | 100.0 /100 | #11 | Exceptional 10.9% |
| Immigrants | Afghanistan | 100.0 /100 | #12 | Exceptional 10.9% |
| Immigrants | South Central Asia | 100.0 /100 | #13 | Exceptional 10.9% |
| Chinese | 100.0 /100 | #14 | Exceptional 11.0% |
| Koreans | 100.0 /100 | #15 | Exceptional 11.0% |