Immigrants from Dominica vs Houma Single Male Poverty
COMPARE
Immigrants from Dominica
Houma
Single Male Poverty
Single Male Poverty Comparison
Immigrants from Dominica
Houma
14.5%
SINGLE MALE POVERTY
0.0/ 100
METRIC RATING
289th/ 347
METRIC RANK
23.5%
SINGLE MALE POVERTY
0.0/ 100
METRIC RATING
342nd/ 347
METRIC RANK
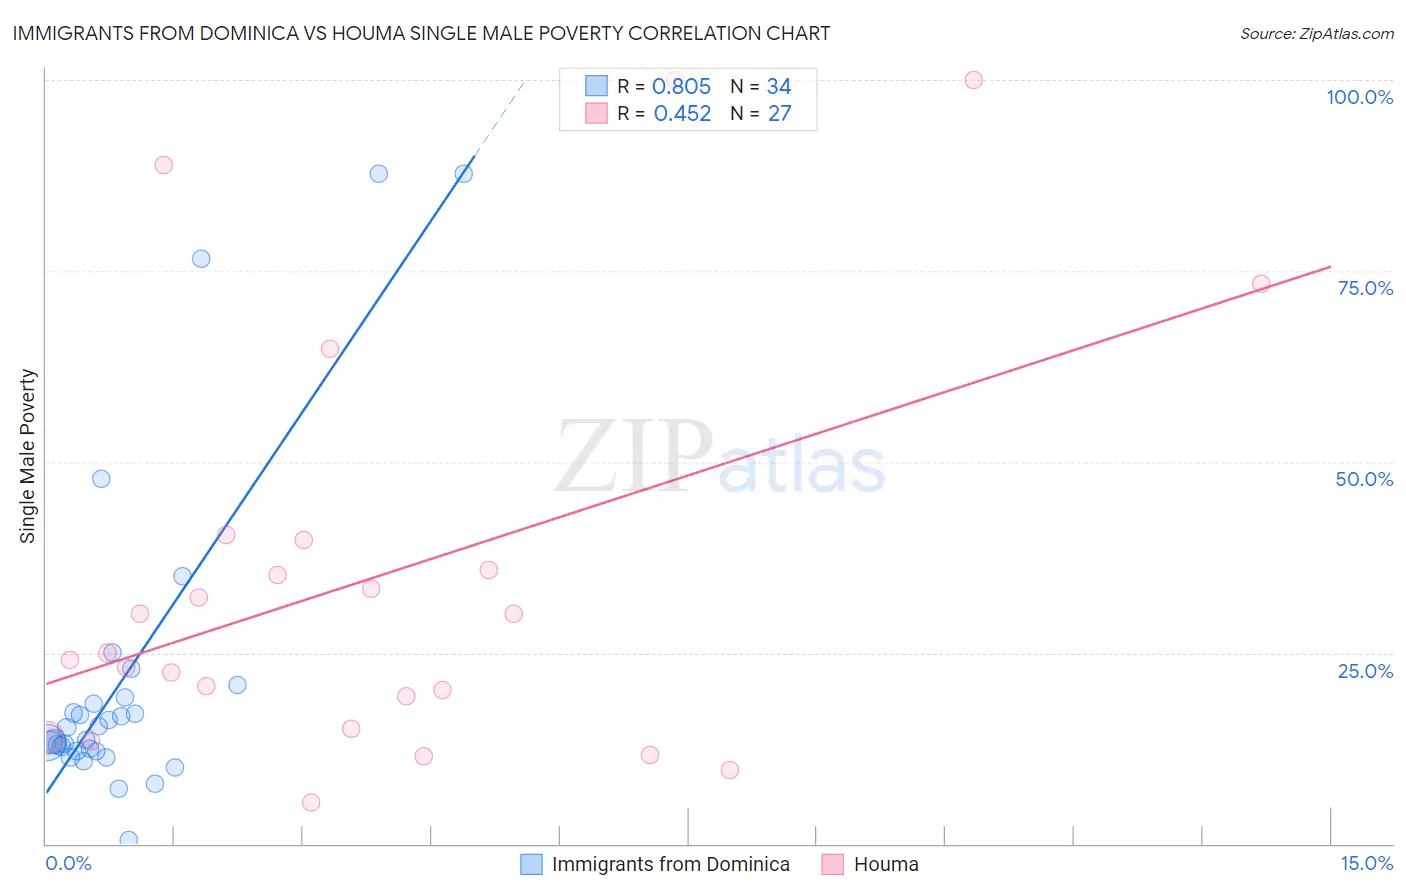
Immigrants from Dominica vs Houma Single Male Poverty Correlation Chart
The statistical analysis conducted on geographies consisting of 81,406,108 people shows a very strong positive correlation between the proportion of Immigrants from Dominica and poverty level among single males in the United States with a correlation coefficient (R) of 0.805 and weighted average of 14.5%. Similarly, the statistical analysis conducted on geographies consisting of 35,894,228 people shows a moderate positive correlation between the proportion of Houma and poverty level among single males in the United States with a correlation coefficient (R) of 0.452 and weighted average of 23.5%, a difference of 61.8%.
Single Male Poverty Correlation Summary
| Measurement | Immigrants from Dominica | Houma |
| Minimum | 0.56% | 5.4% |
| Maximum | 87.7% | 100.0% |
| Range | 87.1% | 94.6% |
| Mean | 21.9% | 34.8% |
| Median | 14.4% | 25.0% |
| Interquartile 25% (IQ1) | 12.1% | 15.1% |
| Interquartile 75% (IQ3) | 19.1% | 39.7% |
| Interquartile Range (IQR) | 7.0% | 24.7% |
| Standard Deviation (Sample) | 21.3% | 27.0% |
| Standard Deviation (Population) | 20.9% | 26.5% |
Similar Demographics by Single Male Poverty
Demographics Similar to Immigrants from Dominica by Single Male Poverty
In terms of single male poverty, the demographic groups most similar to Immigrants from Dominica are Iroquois (14.5%, a difference of 0.090%), White/Caucasian (14.5%, a difference of 0.090%), Celtic (14.5%, a difference of 0.22%), U.S. Virgin Islander (14.5%, a difference of 0.23%), and Bahamian (14.6%, a difference of 0.38%).
| Demographics | Rating | Rank | Single Male Poverty |
| Spanish Americans | 0.0 /100 | #282 | Tragic 14.2% |
| Yaqui | 0.0 /100 | #283 | Tragic 14.2% |
| Immigrants | Bahamas | 0.0 /100 | #284 | Tragic 14.4% |
| French | 0.0 /100 | #285 | Tragic 14.4% |
| Celtics | 0.0 /100 | #286 | Tragic 14.5% |
| Iroquois | 0.0 /100 | #287 | Tragic 14.5% |
| Whites/Caucasians | 0.0 /100 | #288 | Tragic 14.5% |
| Immigrants | Dominica | 0.0 /100 | #289 | Tragic 14.5% |
| U.S. Virgin Islanders | 0.0 /100 | #290 | Tragic 14.5% |
| Bahamians | 0.0 /100 | #291 | Tragic 14.6% |
| Immigrants | Nonimmigrants | 0.0 /100 | #292 | Tragic 14.6% |
| French Canadians | 0.0 /100 | #293 | Tragic 14.6% |
| Ottawa | 0.0 /100 | #294 | Tragic 14.6% |
| Scotch-Irish | 0.0 /100 | #295 | Tragic 14.7% |
| Africans | 0.0 /100 | #296 | Tragic 14.7% |
Demographics Similar to Houma by Single Male Poverty
In terms of single male poverty, the demographic groups most similar to Houma are Crow (23.3%, a difference of 0.82%), Sioux (22.2%, a difference of 5.6%), Arapaho (21.9%, a difference of 6.9%), Puerto Rican (25.1%, a difference of 6.9%), and Lumbee (25.2%, a difference of 7.3%).
| Demographics | Rating | Rank | Single Male Poverty |
| Inupiat | 0.0 /100 | #333 | Tragic 20.0% |
| Pima | 0.0 /100 | #334 | Tragic 20.2% |
| Yuman | 0.0 /100 | #335 | Tragic 21.3% |
| Tohono O'odham | 0.0 /100 | #336 | Tragic 21.6% |
| Apache | 0.0 /100 | #337 | Tragic 21.6% |
| Pueblo | 0.0 /100 | #338 | Tragic 21.6% |
| Arapaho | 0.0 /100 | #339 | Tragic 21.9% |
| Sioux | 0.0 /100 | #340 | Tragic 22.2% |
| Crow | 0.0 /100 | #341 | Tragic 23.3% |
| Houma | 0.0 /100 | #342 | Tragic 23.5% |
| Puerto Ricans | 0.0 /100 | #343 | Tragic 25.1% |
| Lumbee | 0.0 /100 | #344 | Tragic 25.2% |
| Navajo | 0.0 /100 | #345 | Tragic 25.3% |
| Hopi | 0.0 /100 | #346 | Tragic 27.5% |
| Yup'ik | 0.0 /100 | #347 | Tragic 31.6% |