Indonesian vs American Single Male Poverty
COMPARE
Indonesian
American
Single Male Poverty
Single Male Poverty Comparison
Indonesians
Americans
14.1%
SINGLE MALE POVERTY
0.0/ 100
METRIC RATING
279th/ 347
METRIC RANK
15.8%
SINGLE MALE POVERTY
0.0/ 100
METRIC RATING
309th/ 347
METRIC RANK
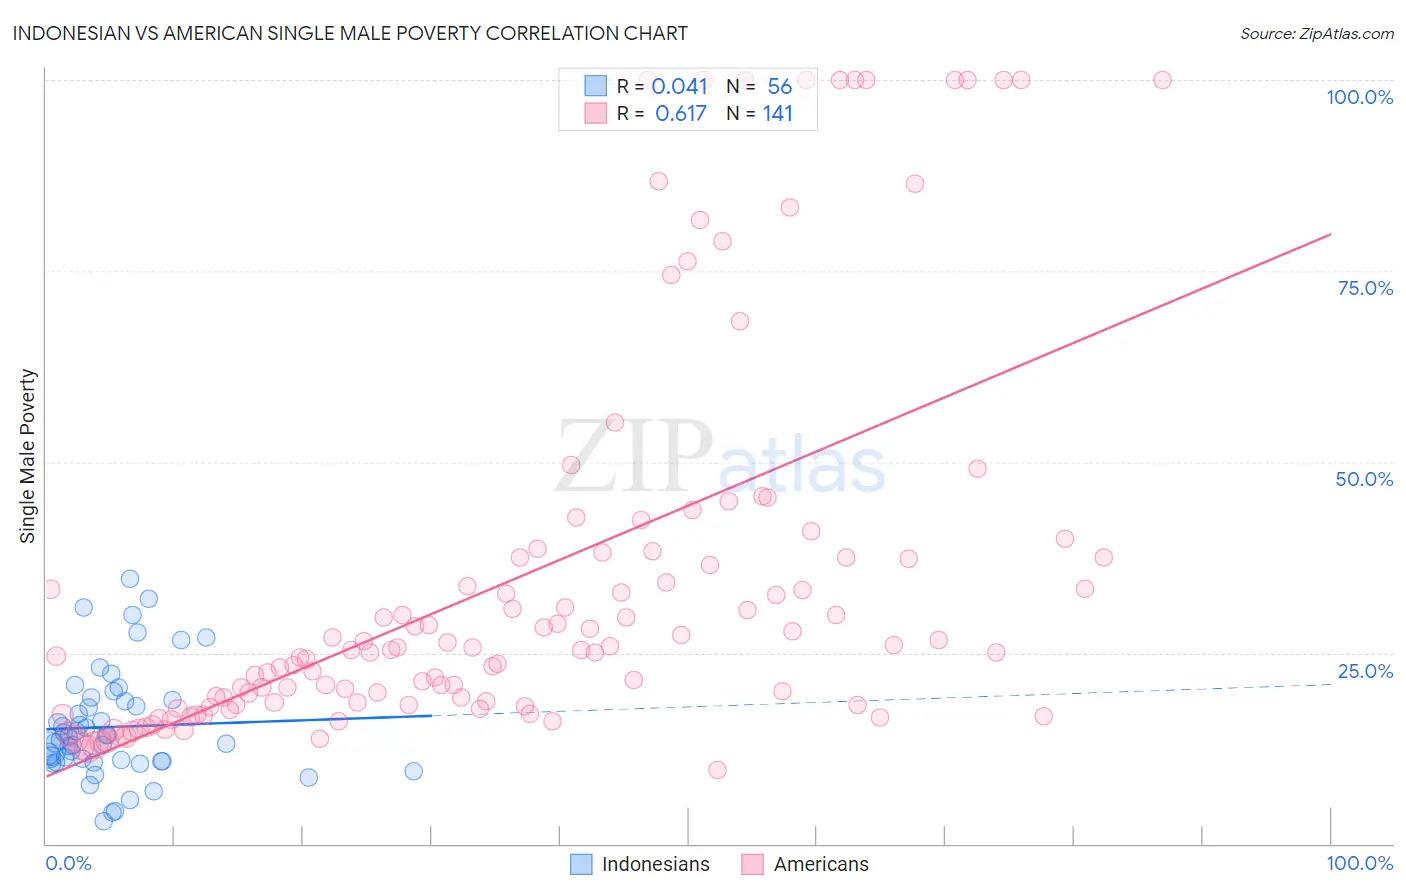
Indonesian vs American Single Male Poverty Correlation Chart
The statistical analysis conducted on geographies consisting of 153,765,867 people shows no correlation between the proportion of Indonesians and poverty level among single males in the United States with a correlation coefficient (R) of 0.041 and weighted average of 14.1%. Similarly, the statistical analysis conducted on geographies consisting of 478,139,646 people shows a significant positive correlation between the proportion of Americans and poverty level among single males in the United States with a correlation coefficient (R) of 0.617 and weighted average of 15.8%, a difference of 12.0%.
Single Male Poverty Correlation Summary
| Measurement | Indonesian | American |
| Minimum | 2.9% | 9.7% |
| Maximum | 34.7% | 100.0% |
| Range | 31.8% | 90.3% |
| Mean | 15.3% | 34.5% |
| Median | 13.9% | 25.4% |
| Interquartile 25% (IQ1) | 10.8% | 18.2% |
| Interquartile 75% (IQ3) | 18.8% | 37.5% |
| Interquartile Range (IQR) | 8.0% | 19.3% |
| Standard Deviation (Sample) | 7.1% | 25.3% |
| Standard Deviation (Population) | 7.1% | 25.2% |
Similar Demographics by Single Male Poverty
Demographics Similar to Indonesians by Single Male Poverty
In terms of single male poverty, the demographic groups most similar to Indonesians are Slovak (14.1%, a difference of 0.040%), Immigrants from Honduras (14.1%, a difference of 0.10%), Dutch (14.1%, a difference of 0.14%), English (14.1%, a difference of 0.26%), and Honduran (14.0%, a difference of 0.34%).
| Demographics | Rating | Rank | Single Male Poverty |
| Mexicans | 0.1 /100 | #272 | Tragic 14.0% |
| Welsh | 0.1 /100 | #273 | Tragic 14.0% |
| Hondurans | 0.1 /100 | #274 | Tragic 14.0% |
| English | 0.1 /100 | #275 | Tragic 14.1% |
| Dutch | 0.1 /100 | #276 | Tragic 14.1% |
| Immigrants | Honduras | 0.0 /100 | #277 | Tragic 14.1% |
| Slovaks | 0.0 /100 | #278 | Tragic 14.1% |
| Indonesians | 0.0 /100 | #279 | Tragic 14.1% |
| Hmong | 0.0 /100 | #280 | Tragic 14.2% |
| Hispanics or Latinos | 0.0 /100 | #281 | Tragic 14.2% |
| Spanish Americans | 0.0 /100 | #282 | Tragic 14.2% |
| Yaqui | 0.0 /100 | #283 | Tragic 14.2% |
| Immigrants | Bahamas | 0.0 /100 | #284 | Tragic 14.4% |
| French | 0.0 /100 | #285 | Tragic 14.4% |
| Celtics | 0.0 /100 | #286 | Tragic 14.5% |
Demographics Similar to Americans by Single Male Poverty
In terms of single male poverty, the demographic groups most similar to Americans are Potawatomi (15.8%, a difference of 0.17%), Ute (15.7%, a difference of 0.73%), Yakama (15.9%, a difference of 0.87%), Seminole (16.0%, a difference of 1.4%), and Comanche (16.0%, a difference of 1.4%).
| Demographics | Rating | Rank | Single Male Poverty |
| Alsatians | 0.0 /100 | #302 | Tragic 15.2% |
| Aleuts | 0.0 /100 | #303 | Tragic 15.4% |
| Alaska Natives | 0.0 /100 | #304 | Tragic 15.4% |
| Blackfeet | 0.0 /100 | #305 | Tragic 15.5% |
| Pennsylvania Germans | 0.0 /100 | #306 | Tragic 15.6% |
| Ute | 0.0 /100 | #307 | Tragic 15.7% |
| Potawatomi | 0.0 /100 | #308 | Tragic 15.8% |
| Americans | 0.0 /100 | #309 | Tragic 15.8% |
| Yakama | 0.0 /100 | #310 | Tragic 15.9% |
| Seminole | 0.0 /100 | #311 | Tragic 16.0% |
| Comanche | 0.0 /100 | #312 | Tragic 16.0% |
| Cherokee | 0.0 /100 | #313 | Tragic 16.1% |
| Alaskan Athabascans | 0.0 /100 | #314 | Tragic 16.1% |
| Cheyenne | 0.0 /100 | #315 | Tragic 16.1% |
| Dutch West Indians | 0.0 /100 | #316 | Tragic 16.1% |