Immigrants from Poland vs Houma Single Male Poverty
COMPARE
Immigrants from Poland
Houma
Single Male Poverty
Single Male Poverty Comparison
Immigrants from Poland
Houma
11.5%
SINGLE MALE POVERTY
99.9/ 100
METRIC RATING
45th/ 347
METRIC RANK
23.5%
SINGLE MALE POVERTY
0.0/ 100
METRIC RATING
342nd/ 347
METRIC RANK
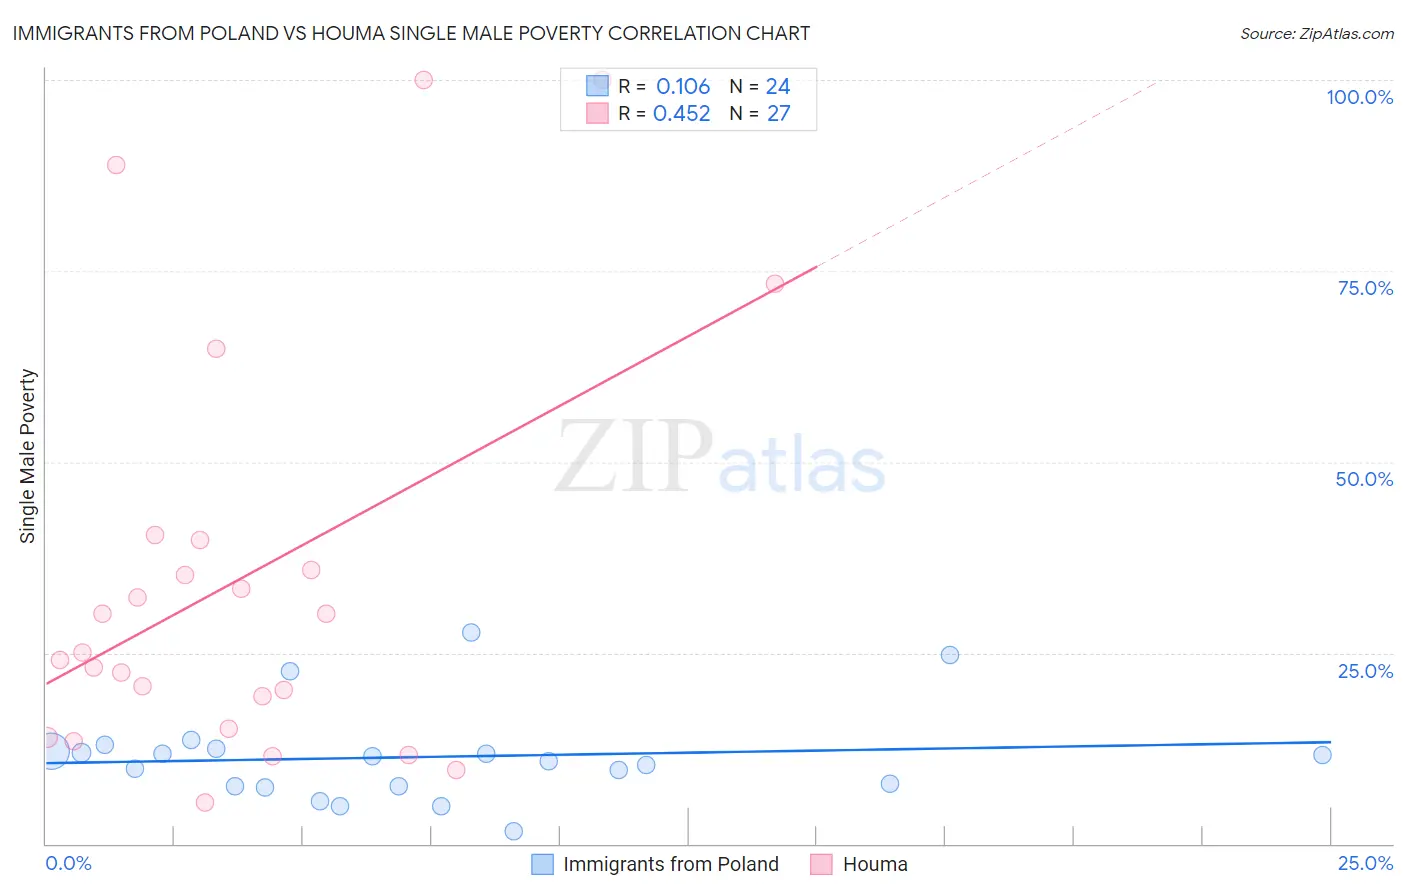
Immigrants from Poland vs Houma Single Male Poverty Correlation Chart
The statistical analysis conducted on geographies consisting of 269,525,262 people shows a poor positive correlation between the proportion of Immigrants from Poland and poverty level among single males in the United States with a correlation coefficient (R) of 0.106 and weighted average of 11.5%. Similarly, the statistical analysis conducted on geographies consisting of 35,894,228 people shows a moderate positive correlation between the proportion of Houma and poverty level among single males in the United States with a correlation coefficient (R) of 0.452 and weighted average of 23.5%, a difference of 103.1%.
Single Male Poverty Correlation Summary
| Measurement | Immigrants from Poland | Houma |
| Minimum | 1.6% | 5.4% |
| Maximum | 27.7% | 100.0% |
| Range | 26.1% | 94.6% |
| Mean | 11.4% | 34.8% |
| Median | 11.1% | 25.0% |
| Interquartile 25% (IQ1) | 7.6% | 15.1% |
| Interquartile 75% (IQ3) | 12.2% | 39.7% |
| Interquartile Range (IQR) | 4.7% | 24.7% |
| Standard Deviation (Sample) | 6.1% | 27.0% |
| Standard Deviation (Population) | 6.0% | 26.5% |
Similar Demographics by Single Male Poverty
Demographics Similar to Immigrants from Poland by Single Male Poverty
In terms of single male poverty, the demographic groups most similar to Immigrants from Poland are Immigrants from Cameroon (11.5%, a difference of 0.020%), Immigrants from Peru (11.5%, a difference of 0.030%), Immigrants from Bulgaria (11.6%, a difference of 0.13%), Egyptian (11.5%, a difference of 0.18%), and Immigrants from Iraq (11.5%, a difference of 0.23%).
| Demographics | Rating | Rank | Single Male Poverty |
| Sri Lankans | 100.0 /100 | #38 | Exceptional 11.5% |
| Soviet Union | 100.0 /100 | #39 | Exceptional 11.5% |
| Immigrants | Korea | 100.0 /100 | #40 | Exceptional 11.5% |
| Immigrants | Iraq | 99.9 /100 | #41 | Exceptional 11.5% |
| Egyptians | 99.9 /100 | #42 | Exceptional 11.5% |
| Immigrants | Peru | 99.9 /100 | #43 | Exceptional 11.5% |
| Immigrants | Cameroon | 99.9 /100 | #44 | Exceptional 11.5% |
| Immigrants | Poland | 99.9 /100 | #45 | Exceptional 11.5% |
| Immigrants | Bulgaria | 99.9 /100 | #46 | Exceptional 11.6% |
| Nepalese | 99.9 /100 | #47 | Exceptional 11.6% |
| Immigrants | Indonesia | 99.9 /100 | #48 | Exceptional 11.6% |
| Tlingit-Haida | 99.9 /100 | #49 | Exceptional 11.6% |
| Immigrants | Lithuania | 99.9 /100 | #50 | Exceptional 11.6% |
| Paraguayans | 99.9 /100 | #51 | Exceptional 11.6% |
| Samoans | 99.9 /100 | #52 | Exceptional 11.7% |
Demographics Similar to Houma by Single Male Poverty
In terms of single male poverty, the demographic groups most similar to Houma are Crow (23.3%, a difference of 0.82%), Sioux (22.2%, a difference of 5.6%), Arapaho (21.9%, a difference of 6.9%), Puerto Rican (25.1%, a difference of 6.9%), and Lumbee (25.2%, a difference of 7.3%).
| Demographics | Rating | Rank | Single Male Poverty |
| Inupiat | 0.0 /100 | #333 | Tragic 20.0% |
| Pima | 0.0 /100 | #334 | Tragic 20.2% |
| Yuman | 0.0 /100 | #335 | Tragic 21.3% |
| Tohono O'odham | 0.0 /100 | #336 | Tragic 21.6% |
| Apache | 0.0 /100 | #337 | Tragic 21.6% |
| Pueblo | 0.0 /100 | #338 | Tragic 21.6% |
| Arapaho | 0.0 /100 | #339 | Tragic 21.9% |
| Sioux | 0.0 /100 | #340 | Tragic 22.2% |
| Crow | 0.0 /100 | #341 | Tragic 23.3% |
| Houma | 0.0 /100 | #342 | Tragic 23.5% |
| Puerto Ricans | 0.0 /100 | #343 | Tragic 25.1% |
| Lumbee | 0.0 /100 | #344 | Tragic 25.2% |
| Navajo | 0.0 /100 | #345 | Tragic 25.3% |
| Hopi | 0.0 /100 | #346 | Tragic 27.5% |
| Yup'ik | 0.0 /100 | #347 | Tragic 31.6% |