Indonesian vs Houma Median Earnings
COMPARE
Indonesian
Houma
Median Earnings
Median Earnings Comparison
Indonesians
Houma
$41,701
MEDIAN EARNINGS
0.1/ 100
METRIC RATING
287th/ 347
METRIC RANK
$38,949
MEDIAN EARNINGS
0.0/ 100
METRIC RATING
333rd/ 347
METRIC RANK
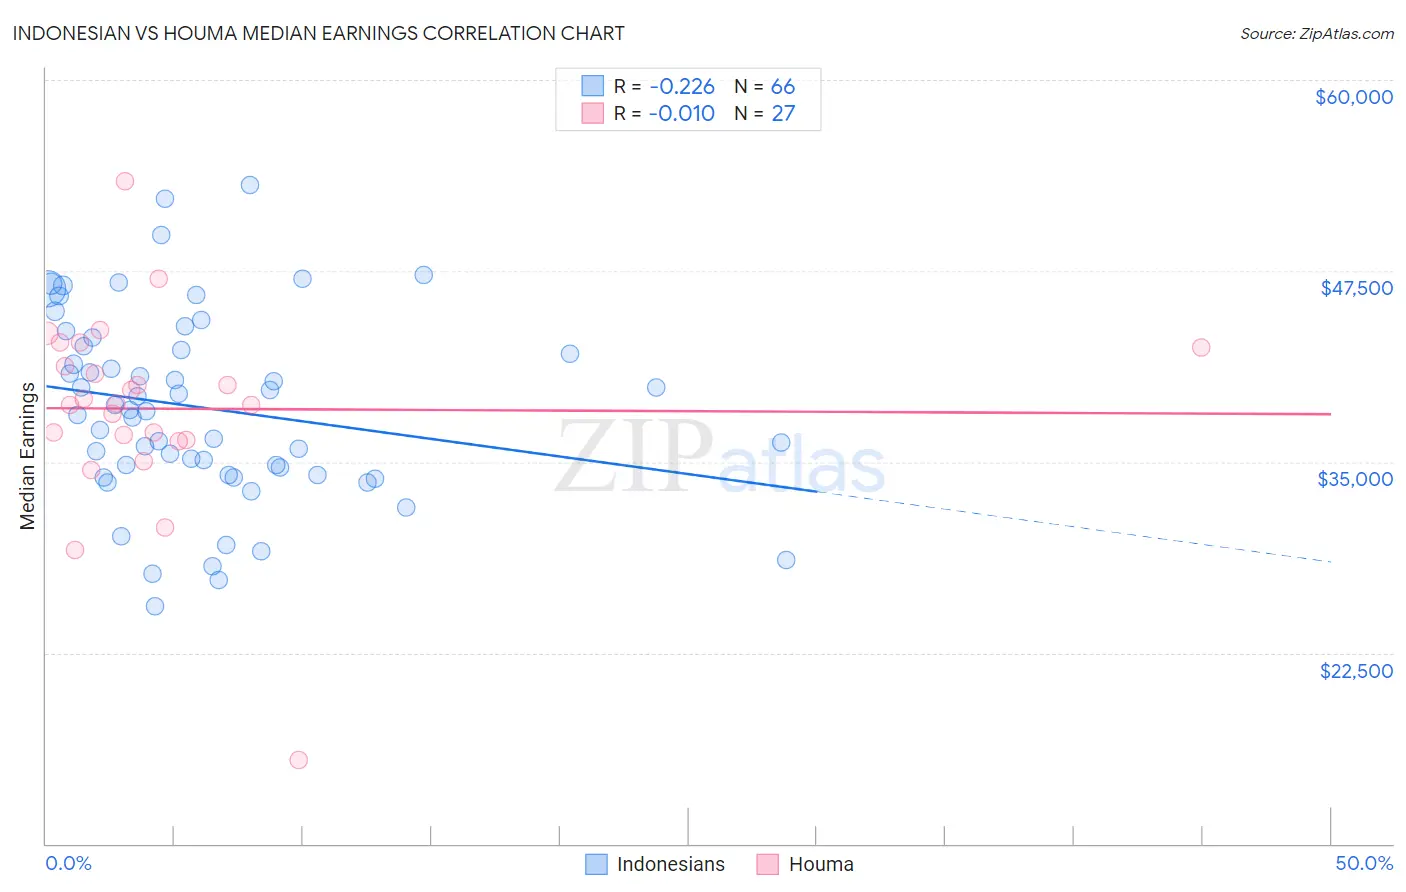
Indonesian vs Houma Median Earnings Correlation Chart
The statistical analysis conducted on geographies consisting of 162,738,870 people shows a weak negative correlation between the proportion of Indonesians and median earnings in the United States with a correlation coefficient (R) of -0.226 and weighted average of $41,701. Similarly, the statistical analysis conducted on geographies consisting of 36,796,366 people shows no correlation between the proportion of Houma and median earnings in the United States with a correlation coefficient (R) of -0.010 and weighted average of $38,949, a difference of 7.1%.
Median Earnings Correlation Summary
| Measurement | Indonesian | Houma |
| Minimum | $25,580 | $15,495 |
| Maximum | $53,125 | $53,358 |
| Range | $27,545 | $37,863 |
| Mean | $38,511 | $38,485 |
| Median | $38,377 | $38,771 |
| Interquartile 25% (IQ1) | $34,157 | $36,392 |
| Interquartile 75% (IQ3) | $42,572 | $42,500 |
| Interquartile Range (IQR) | $8,415 | $6,108 |
| Standard Deviation (Sample) | $6,165 | $6,619 |
| Standard Deviation (Population) | $6,119 | $6,495 |
Similar Demographics by Median Earnings
Demographics Similar to Indonesians by Median Earnings
In terms of median earnings, the demographic groups most similar to Indonesians are Mexican American Indian ($41,719, a difference of 0.040%), Immigrants from Nicaragua ($41,737, a difference of 0.090%), Blackfeet ($41,822, a difference of 0.29%), Immigrants from Dominican Republic ($41,554, a difference of 0.35%), and Dominican ($41,864, a difference of 0.39%).
| Demographics | Rating | Rank | Median Earnings |
| Hmong | 0.2 /100 | #280 | Tragic $42,111 |
| Marshallese | 0.2 /100 | #281 | Tragic $41,969 |
| Africans | 0.2 /100 | #282 | Tragic $41,955 |
| Dominicans | 0.2 /100 | #283 | Tragic $41,864 |
| Blackfeet | 0.2 /100 | #284 | Tragic $41,822 |
| Immigrants | Nicaragua | 0.1 /100 | #285 | Tragic $41,737 |
| Mexican American Indians | 0.1 /100 | #286 | Tragic $41,719 |
| Indonesians | 0.1 /100 | #287 | Tragic $41,701 |
| Immigrants | Dominican Republic | 0.1 /100 | #288 | Tragic $41,554 |
| Comanche | 0.1 /100 | #289 | Tragic $41,519 |
| Paiute | 0.1 /100 | #290 | Tragic $41,508 |
| Central American Indians | 0.1 /100 | #291 | Tragic $41,474 |
| U.S. Virgin Islanders | 0.1 /100 | #292 | Tragic $41,448 |
| Immigrants | Zaire | 0.1 /100 | #293 | Tragic $41,325 |
| Potawatomi | 0.1 /100 | #294 | Tragic $41,288 |
Demographics Similar to Houma by Median Earnings
In terms of median earnings, the demographic groups most similar to Houma are Spanish American Indian ($38,907, a difference of 0.11%), Native/Alaskan ($38,896, a difference of 0.14%), Yakama ($39,107, a difference of 0.41%), Immigrants from Mexico ($39,114, a difference of 0.42%), and Immigrants from Congo ($39,169, a difference of 0.57%).
| Demographics | Rating | Rank | Median Earnings |
| Immigrants | Yemen | 0.0 /100 | #326 | Tragic $39,540 |
| Yuman | 0.0 /100 | #327 | Tragic $39,523 |
| Sioux | 0.0 /100 | #328 | Tragic $39,448 |
| Kiowa | 0.0 /100 | #329 | Tragic $39,232 |
| Immigrants | Congo | 0.0 /100 | #330 | Tragic $39,169 |
| Immigrants | Mexico | 0.0 /100 | #331 | Tragic $39,114 |
| Yakama | 0.0 /100 | #332 | Tragic $39,107 |
| Houma | 0.0 /100 | #333 | Tragic $38,949 |
| Spanish American Indians | 0.0 /100 | #334 | Tragic $38,907 |
| Natives/Alaskans | 0.0 /100 | #335 | Tragic $38,896 |
| Crow | 0.0 /100 | #336 | Tragic $38,707 |
| Immigrants | Cuba | 0.0 /100 | #337 | Tragic $38,426 |
| Pima | 0.0 /100 | #338 | Tragic $38,285 |
| Menominee | 0.0 /100 | #339 | Tragic $37,884 |
| Navajo | 0.0 /100 | #340 | Tragic $36,999 |