Indonesian vs Swiss Single Male Poverty
COMPARE
Indonesian
Swiss
Single Male Poverty
Single Male Poverty Comparison
Indonesians
Swiss
14.1%
SINGLE MALE POVERTY
0.0/ 100
METRIC RATING
279th/ 347
METRIC RANK
13.8%
SINGLE MALE POVERTY
0.3/ 100
METRIC RATING
260th/ 347
METRIC RANK
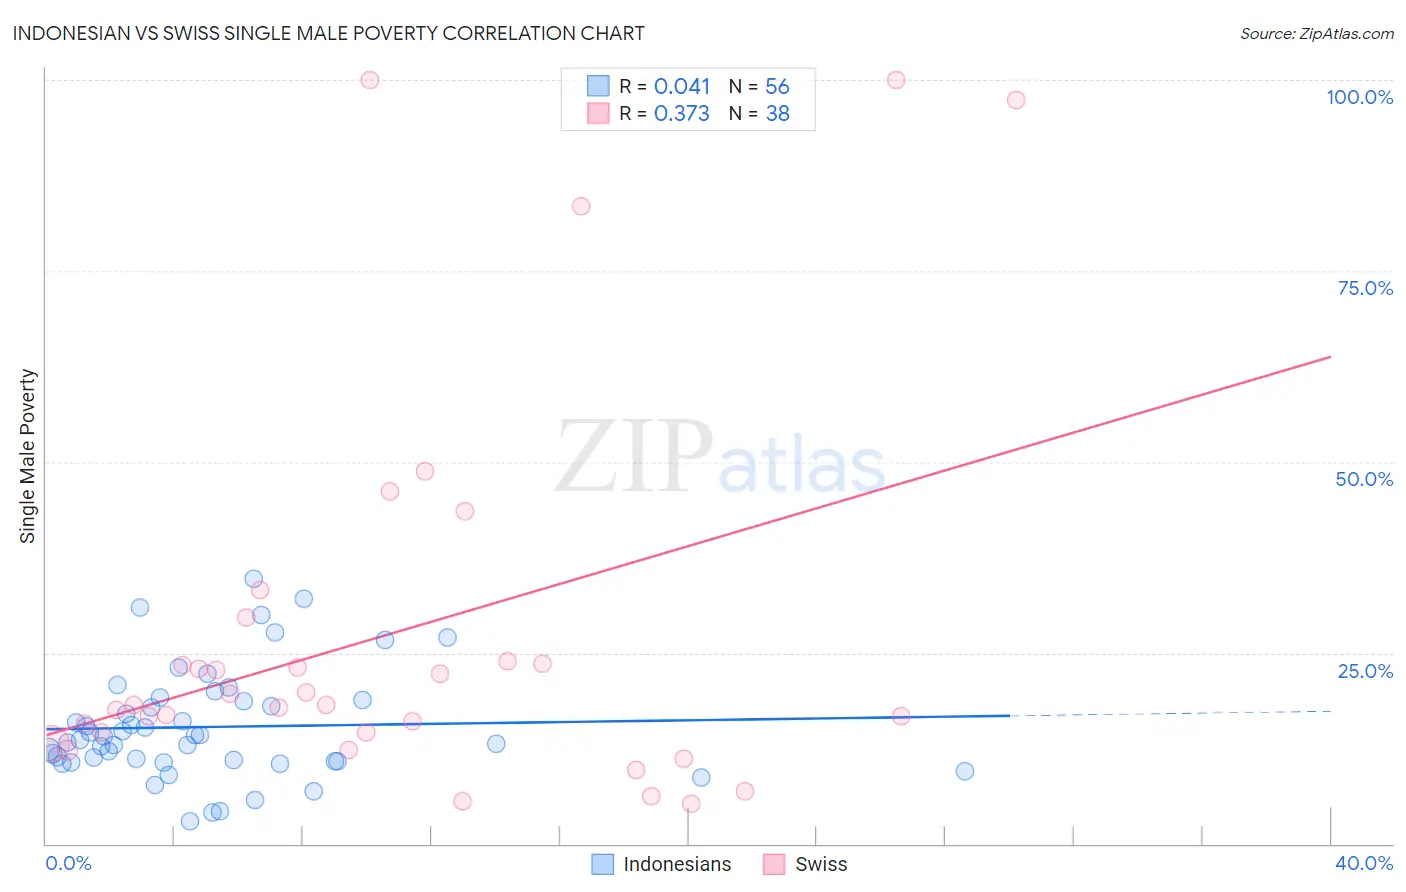
Indonesian vs Swiss Single Male Poverty Correlation Chart
The statistical analysis conducted on geographies consisting of 153,765,867 people shows no correlation between the proportion of Indonesians and poverty level among single males in the United States with a correlation coefficient (R) of 0.041 and weighted average of 14.1%. Similarly, the statistical analysis conducted on geographies consisting of 396,994,211 people shows a mild positive correlation between the proportion of Swiss and poverty level among single males in the United States with a correlation coefficient (R) of 0.373 and weighted average of 13.8%, a difference of 2.3%.
Single Male Poverty Correlation Summary
| Measurement | Indonesian | Swiss |
| Minimum | 2.9% | 5.3% |
| Maximum | 34.7% | 100.0% |
| Range | 31.8% | 94.7% |
| Mean | 15.3% | 27.6% |
| Median | 13.9% | 18.2% |
| Interquartile 25% (IQ1) | 10.8% | 14.5% |
| Interquartile 75% (IQ3) | 18.8% | 23.8% |
| Interquartile Range (IQR) | 8.0% | 9.3% |
| Standard Deviation (Sample) | 7.1% | 25.6% |
| Standard Deviation (Population) | 7.1% | 25.3% |
Demographics Similar to Indonesians and Swiss by Single Male Poverty
In terms of single male poverty, the demographic groups most similar to Indonesians are Slovak (14.1%, a difference of 0.040%), Immigrants from Honduras (14.1%, a difference of 0.10%), Dutch (14.1%, a difference of 0.14%), English (14.1%, a difference of 0.26%), and Honduran (14.0%, a difference of 0.34%). Similarly, the demographic groups most similar to Swiss are Hungarian (13.8%, a difference of 0.050%), Guatemalan (13.8%, a difference of 0.070%), Fijian (13.8%, a difference of 0.22%), Cape Verdean (13.8%, a difference of 0.34%), and West Indian (13.8%, a difference of 0.53%).
| Demographics | Rating | Rank | Single Male Poverty |
| Guatemalans | 0.3 /100 | #259 | Tragic 13.8% |
| Swiss | 0.3 /100 | #260 | Tragic 13.8% |
| Hungarians | 0.3 /100 | #261 | Tragic 13.8% |
| Fijians | 0.3 /100 | #262 | Tragic 13.8% |
| Cape Verdeans | 0.2 /100 | #263 | Tragic 13.8% |
| West Indians | 0.2 /100 | #264 | Tragic 13.8% |
| Immigrants | Congo | 0.2 /100 | #265 | Tragic 13.9% |
| Immigrants | Cabo Verde | 0.1 /100 | #266 | Tragic 13.9% |
| Germans | 0.1 /100 | #267 | Tragic 13.9% |
| Immigrants | Mexico | 0.1 /100 | #268 | Tragic 13.9% |
| Scottish | 0.1 /100 | #269 | Tragic 14.0% |
| Immigrants | Saudi Arabia | 0.1 /100 | #270 | Tragic 14.0% |
| Irish | 0.1 /100 | #271 | Tragic 14.0% |
| Mexicans | 0.1 /100 | #272 | Tragic 14.0% |
| Welsh | 0.1 /100 | #273 | Tragic 14.0% |
| Hondurans | 0.1 /100 | #274 | Tragic 14.0% |
| English | 0.1 /100 | #275 | Tragic 14.1% |
| Dutch | 0.1 /100 | #276 | Tragic 14.1% |
| Immigrants | Honduras | 0.0 /100 | #277 | Tragic 14.1% |
| Slovaks | 0.0 /100 | #278 | Tragic 14.1% |
| Indonesians | 0.0 /100 | #279 | Tragic 14.1% |