Immigrants from Western Africa vs Houma Single Male Poverty
COMPARE
Immigrants from Western Africa
Houma
Single Male Poverty
Single Male Poverty Comparison
Immigrants from Western Africa
Houma
13.1%
SINGLE MALE POVERTY
17.6/ 100
METRIC RATING
208th/ 347
METRIC RANK
23.5%
SINGLE MALE POVERTY
0.0/ 100
METRIC RATING
342nd/ 347
METRIC RANK
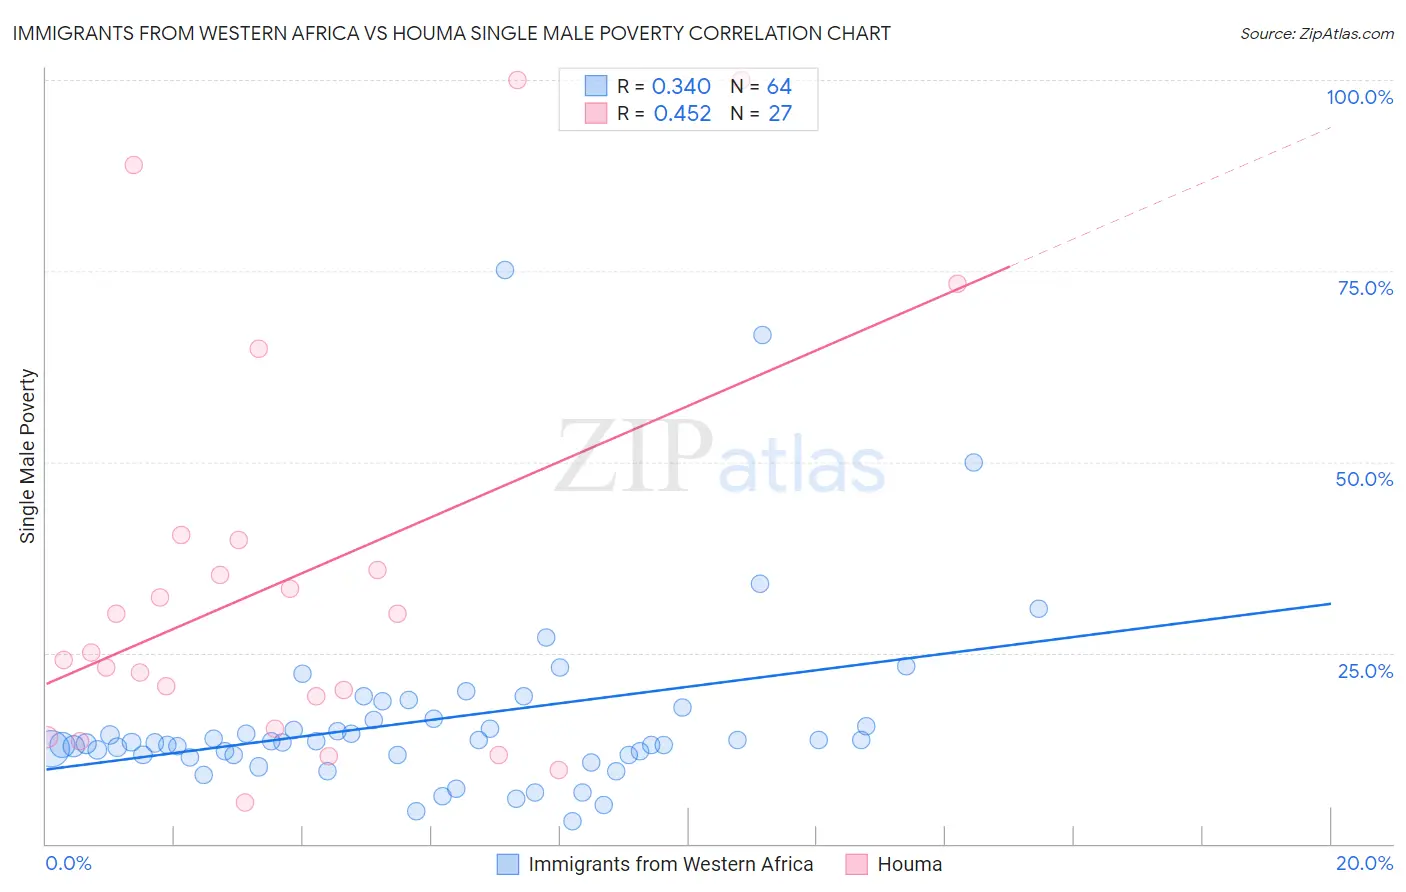
Immigrants from Western Africa vs Houma Single Male Poverty Correlation Chart
The statistical analysis conducted on geographies consisting of 322,395,283 people shows a mild positive correlation between the proportion of Immigrants from Western Africa and poverty level among single males in the United States with a correlation coefficient (R) of 0.340 and weighted average of 13.1%. Similarly, the statistical analysis conducted on geographies consisting of 35,894,228 people shows a moderate positive correlation between the proportion of Houma and poverty level among single males in the United States with a correlation coefficient (R) of 0.452 and weighted average of 23.5%, a difference of 79.6%.
Single Male Poverty Correlation Summary
| Measurement | Immigrants from Western Africa | Houma |
| Minimum | 2.9% | 5.4% |
| Maximum | 75.2% | 100.0% |
| Range | 72.3% | 94.6% |
| Mean | 16.2% | 34.8% |
| Median | 13.2% | 25.0% |
| Interquartile 25% (IQ1) | 11.6% | 15.1% |
| Interquartile 75% (IQ3) | 16.3% | 39.7% |
| Interquartile Range (IQR) | 4.7% | 24.7% |
| Standard Deviation (Sample) | 12.3% | 27.0% |
| Standard Deviation (Population) | 12.2% | 26.5% |
Similar Demographics by Single Male Poverty
Demographics Similar to Immigrants from Western Africa by Single Male Poverty
In terms of single male poverty, the demographic groups most similar to Immigrants from Western Africa are Sudanese (13.1%, a difference of 0.010%), Mexican American Indian (13.1%, a difference of 0.010%), Immigrants from Haiti (13.1%, a difference of 0.070%), Swedish (13.1%, a difference of 0.080%), and Northern European (13.0%, a difference of 0.11%).
| Demographics | Rating | Rank | Single Male Poverty |
| Trinidadians and Tobagonians | 21.4 /100 | #201 | Fair 13.0% |
| Basques | 20.7 /100 | #202 | Fair 13.0% |
| Immigrants | Bangladesh | 20.4 /100 | #203 | Fair 13.0% |
| Estonians | 20.3 /100 | #204 | Fair 13.0% |
| Poles | 19.3 /100 | #205 | Poor 13.0% |
| Northern Europeans | 18.9 /100 | #206 | Poor 13.0% |
| Sudanese | 17.7 /100 | #207 | Poor 13.1% |
| Immigrants | Western Africa | 17.6 /100 | #208 | Poor 13.1% |
| Mexican American Indians | 17.5 /100 | #209 | Poor 13.1% |
| Immigrants | Haiti | 16.8 /100 | #210 | Poor 13.1% |
| Swedes | 16.8 /100 | #211 | Poor 13.1% |
| Senegalese | 16.4 /100 | #212 | Poor 13.1% |
| Italians | 15.9 /100 | #213 | Poor 13.1% |
| Zimbabweans | 14.9 /100 | #214 | Poor 13.1% |
| Japanese | 14.8 /100 | #215 | Poor 13.1% |
Demographics Similar to Houma by Single Male Poverty
In terms of single male poverty, the demographic groups most similar to Houma are Crow (23.3%, a difference of 0.82%), Sioux (22.2%, a difference of 5.6%), Arapaho (21.9%, a difference of 6.9%), Puerto Rican (25.1%, a difference of 6.9%), and Lumbee (25.2%, a difference of 7.3%).
| Demographics | Rating | Rank | Single Male Poverty |
| Inupiat | 0.0 /100 | #333 | Tragic 20.0% |
| Pima | 0.0 /100 | #334 | Tragic 20.2% |
| Yuman | 0.0 /100 | #335 | Tragic 21.3% |
| Tohono O'odham | 0.0 /100 | #336 | Tragic 21.6% |
| Apache | 0.0 /100 | #337 | Tragic 21.6% |
| Pueblo | 0.0 /100 | #338 | Tragic 21.6% |
| Arapaho | 0.0 /100 | #339 | Tragic 21.9% |
| Sioux | 0.0 /100 | #340 | Tragic 22.2% |
| Crow | 0.0 /100 | #341 | Tragic 23.3% |
| Houma | 0.0 /100 | #342 | Tragic 23.5% |
| Puerto Ricans | 0.0 /100 | #343 | Tragic 25.1% |
| Lumbee | 0.0 /100 | #344 | Tragic 25.2% |
| Navajo | 0.0 /100 | #345 | Tragic 25.3% |
| Hopi | 0.0 /100 | #346 | Tragic 27.5% |
| Yup'ik | 0.0 /100 | #347 | Tragic 31.6% |