Immigrants from West Indies vs Jamaican Female Poverty
COMPARE
Immigrants from West Indies
Jamaican
Female Poverty
Female Poverty Comparison
Immigrants from West Indies
Jamaicans
16.1%
FEMALE POVERTY
0.0/ 100
METRIC RATING
278th/ 347
METRIC RANK
15.5%
FEMALE POVERTY
0.2/ 100
METRIC RATING
256th/ 347
METRIC RANK
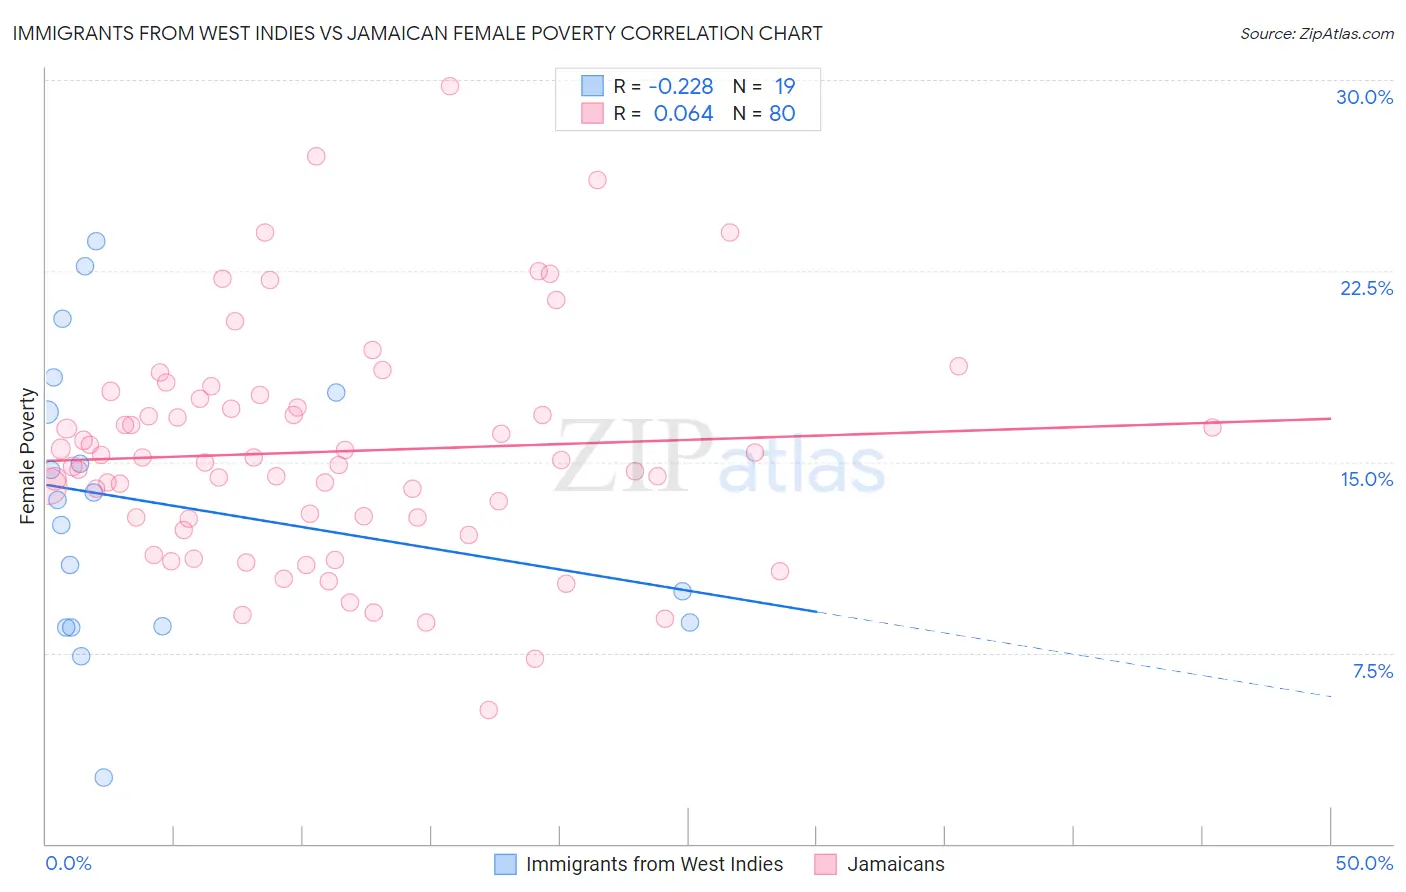
Immigrants from West Indies vs Jamaican Female Poverty Correlation Chart
The statistical analysis conducted on geographies consisting of 72,454,628 people shows a weak negative correlation between the proportion of Immigrants from West Indies and poverty level among females in the United States with a correlation coefficient (R) of -0.228 and weighted average of 16.1%. Similarly, the statistical analysis conducted on geographies consisting of 367,594,174 people shows a slight positive correlation between the proportion of Jamaicans and poverty level among females in the United States with a correlation coefficient (R) of 0.064 and weighted average of 15.5%, a difference of 3.3%.
Female Poverty Correlation Summary
| Measurement | Immigrants from West Indies | Jamaican |
| Minimum | 2.6% | 5.3% |
| Maximum | 23.6% | 29.8% |
| Range | 21.0% | 24.5% |
| Mean | 13.4% | 15.4% |
| Median | 13.5% | 15.0% |
| Interquartile 25% (IQ1) | 8.5% | 12.8% |
| Interquartile 75% (IQ3) | 17.7% | 17.3% |
| Interquartile Range (IQR) | 9.2% | 4.5% |
| Standard Deviation (Sample) | 5.6% | 4.5% |
| Standard Deviation (Population) | 5.5% | 4.5% |
Similar Demographics by Female Poverty
Demographics Similar to Immigrants from West Indies by Female Poverty
In terms of female poverty, the demographic groups most similar to Immigrants from West Indies are Immigrants from Bahamas (16.1%, a difference of 0.12%), Bangladeshi (16.0%, a difference of 0.31%), Vietnamese (16.1%, a difference of 0.35%), West Indian (16.1%, a difference of 0.37%), and Central American (16.0%, a difference of 0.50%).
| Demographics | Rating | Rank | Female Poverty |
| Immigrants | St. Vincent and the Grenadines | 0.0 /100 | #271 | Tragic 15.9% |
| Belizeans | 0.0 /100 | #272 | Tragic 15.9% |
| Haitians | 0.0 /100 | #273 | Tragic 15.9% |
| Barbadians | 0.0 /100 | #274 | Tragic 15.9% |
| Immigrants | Barbados | 0.0 /100 | #275 | Tragic 16.0% |
| Central Americans | 0.0 /100 | #276 | Tragic 16.0% |
| Bangladeshis | 0.0 /100 | #277 | Tragic 16.0% |
| Immigrants | West Indies | 0.0 /100 | #278 | Tragic 16.1% |
| Immigrants | Bahamas | 0.0 /100 | #279 | Tragic 16.1% |
| Vietnamese | 0.0 /100 | #280 | Tragic 16.1% |
| West Indians | 0.0 /100 | #281 | Tragic 16.1% |
| Immigrants | Haiti | 0.0 /100 | #282 | Tragic 16.1% |
| Immigrants | Cuba | 0.0 /100 | #283 | Tragic 16.1% |
| Spanish Americans | 0.0 /100 | #284 | Tragic 16.2% |
| Comanche | 0.0 /100 | #285 | Tragic 16.2% |
Demographics Similar to Jamaicans by Female Poverty
In terms of female poverty, the demographic groups most similar to Jamaicans are Immigrants from Jamaica (15.6%, a difference of 0.12%), Shoshone (15.6%, a difference of 0.19%), Ottawa (15.5%, a difference of 0.30%), Cape Verdean (15.6%, a difference of 0.30%), and Immigrants from Guyana (15.6%, a difference of 0.38%).
| Demographics | Rating | Rank | Female Poverty |
| Salvadorans | 0.3 /100 | #249 | Tragic 15.3% |
| Immigrants | Western Africa | 0.3 /100 | #250 | Tragic 15.3% |
| Immigrants | Trinidad and Tobago | 0.3 /100 | #251 | Tragic 15.4% |
| Immigrants | Burma/Myanmar | 0.3 /100 | #252 | Tragic 15.4% |
| Liberians | 0.2 /100 | #253 | Tragic 15.4% |
| Trinidadians and Tobagonians | 0.2 /100 | #254 | Tragic 15.4% |
| Ottawa | 0.2 /100 | #255 | Tragic 15.5% |
| Jamaicans | 0.2 /100 | #256 | Tragic 15.5% |
| Immigrants | Jamaica | 0.1 /100 | #257 | Tragic 15.6% |
| Shoshone | 0.1 /100 | #258 | Tragic 15.6% |
| Cape Verdeans | 0.1 /100 | #259 | Tragic 15.6% |
| Immigrants | Guyana | 0.1 /100 | #260 | Tragic 15.6% |
| Guyanese | 0.1 /100 | #261 | Tragic 15.6% |
| Mexican American Indians | 0.1 /100 | #262 | Tragic 15.6% |
| Cherokee | 0.1 /100 | #263 | Tragic 15.6% |