Immigrants from West Indies vs Immigrants from Canada Female Poverty
COMPARE
Immigrants from West Indies
Immigrants from Canada
Female Poverty
Female Poverty Comparison
Immigrants from West Indies
Immigrants from Canada
16.1%
FEMALE POVERTY
0.0/ 100
METRIC RATING
278th/ 347
METRIC RANK
12.3%
FEMALE POVERTY
97.5/ 100
METRIC RATING
74th/ 347
METRIC RANK
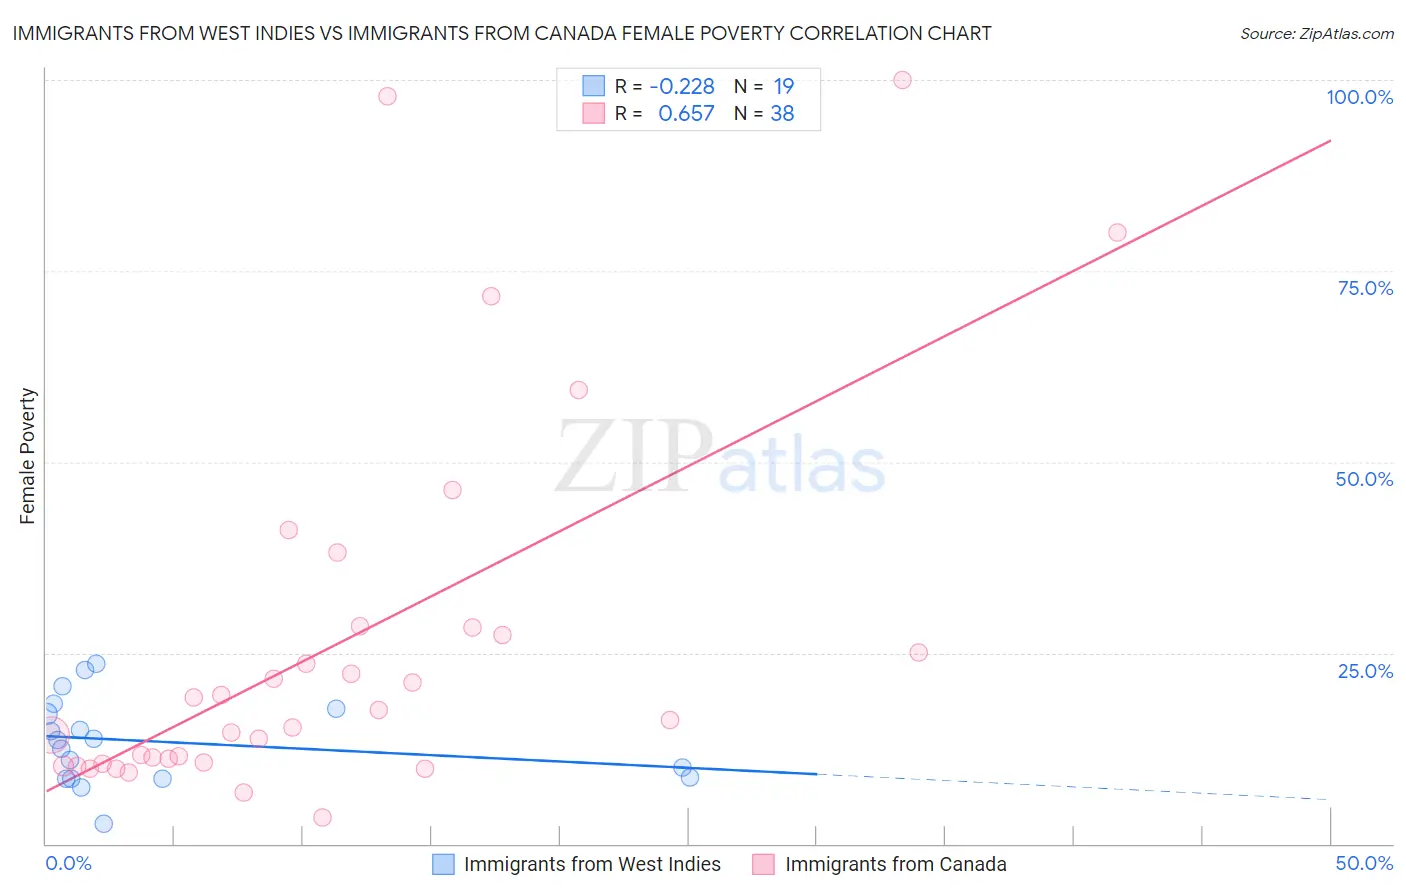
Immigrants from West Indies vs Immigrants from Canada Female Poverty Correlation Chart
The statistical analysis conducted on geographies consisting of 72,454,628 people shows a weak negative correlation between the proportion of Immigrants from West Indies and poverty level among females in the United States with a correlation coefficient (R) of -0.228 and weighted average of 16.1%. Similarly, the statistical analysis conducted on geographies consisting of 458,964,153 people shows a significant positive correlation between the proportion of Immigrants from Canada and poverty level among females in the United States with a correlation coefficient (R) of 0.657 and weighted average of 12.3%, a difference of 31.0%.
Female Poverty Correlation Summary
| Measurement | Immigrants from West Indies | Immigrants from Canada |
| Minimum | 2.6% | 3.5% |
| Maximum | 23.6% | 100.0% |
| Range | 21.0% | 96.5% |
| Mean | 13.4% | 26.2% |
| Median | 13.5% | 16.9% |
| Interquartile 25% (IQ1) | 8.5% | 10.6% |
| Interquartile 75% (IQ3) | 17.7% | 28.3% |
| Interquartile Range (IQR) | 9.2% | 17.8% |
| Standard Deviation (Sample) | 5.6% | 24.5% |
| Standard Deviation (Population) | 5.5% | 24.2% |
Similar Demographics by Female Poverty
Demographics Similar to Immigrants from West Indies by Female Poverty
In terms of female poverty, the demographic groups most similar to Immigrants from West Indies are Immigrants from Bahamas (16.1%, a difference of 0.12%), Bangladeshi (16.0%, a difference of 0.31%), Vietnamese (16.1%, a difference of 0.35%), West Indian (16.1%, a difference of 0.37%), and Central American (16.0%, a difference of 0.50%).
| Demographics | Rating | Rank | Female Poverty |
| Immigrants | St. Vincent and the Grenadines | 0.0 /100 | #271 | Tragic 15.9% |
| Belizeans | 0.0 /100 | #272 | Tragic 15.9% |
| Haitians | 0.0 /100 | #273 | Tragic 15.9% |
| Barbadians | 0.0 /100 | #274 | Tragic 15.9% |
| Immigrants | Barbados | 0.0 /100 | #275 | Tragic 16.0% |
| Central Americans | 0.0 /100 | #276 | Tragic 16.0% |
| Bangladeshis | 0.0 /100 | #277 | Tragic 16.0% |
| Immigrants | West Indies | 0.0 /100 | #278 | Tragic 16.1% |
| Immigrants | Bahamas | 0.0 /100 | #279 | Tragic 16.1% |
| Vietnamese | 0.0 /100 | #280 | Tragic 16.1% |
| West Indians | 0.0 /100 | #281 | Tragic 16.1% |
| Immigrants | Haiti | 0.0 /100 | #282 | Tragic 16.1% |
| Immigrants | Cuba | 0.0 /100 | #283 | Tragic 16.1% |
| Spanish Americans | 0.0 /100 | #284 | Tragic 16.2% |
| Comanche | 0.0 /100 | #285 | Tragic 16.2% |
Demographics Similar to Immigrants from Canada by Female Poverty
In terms of female poverty, the demographic groups most similar to Immigrants from Canada are Zimbabwean (12.3%, a difference of 0.010%), Cambodian (12.2%, a difference of 0.030%), Carpatho Rusyn (12.2%, a difference of 0.060%), European (12.3%, a difference of 0.12%), and Immigrants from Belgium (12.2%, a difference of 0.19%).
| Demographics | Rating | Rank | Female Poverty |
| Immigrants | Eastern Asia | 97.8 /100 | #67 | Exceptional 12.2% |
| Immigrants | Netherlands | 97.8 /100 | #68 | Exceptional 12.2% |
| Swiss | 97.7 /100 | #69 | Exceptional 12.2% |
| Immigrants | Belgium | 97.7 /100 | #70 | Exceptional 12.2% |
| Carpatho Rusyns | 97.6 /100 | #71 | Exceptional 12.2% |
| Cambodians | 97.5 /100 | #72 | Exceptional 12.2% |
| Zimbabweans | 97.5 /100 | #73 | Exceptional 12.3% |
| Immigrants | Canada | 97.5 /100 | #74 | Exceptional 12.3% |
| Europeans | 97.4 /100 | #75 | Exceptional 12.3% |
| Immigrants | Eastern Europe | 97.2 /100 | #76 | Exceptional 12.3% |
| Serbians | 97.2 /100 | #77 | Exceptional 12.3% |
| Egyptians | 97.2 /100 | #78 | Exceptional 12.3% |
| Immigrants | North America | 97.1 /100 | #79 | Exceptional 12.3% |
| Slovaks | 97.1 /100 | #80 | Exceptional 12.3% |
| Immigrants | Sweden | 97.1 /100 | #81 | Exceptional 12.3% |