Immigrants from Uganda vs Sioux Child Poverty Among Girls Under 16
COMPARE
Immigrants from Uganda
Sioux
Child Poverty Among Girls Under 16
Child Poverty Among Girls Under 16 Comparison
Immigrants from Uganda
Sioux
16.8%
CHILD POVERTY AMONG GIRLS UNDER 16
31.3/ 100
METRIC RATING
192nd/ 347
METRIC RANK
25.6%
CHILD POVERTY AMONG GIRLS UNDER 16
0.0/ 100
METRIC RATING
336th/ 347
METRIC RANK
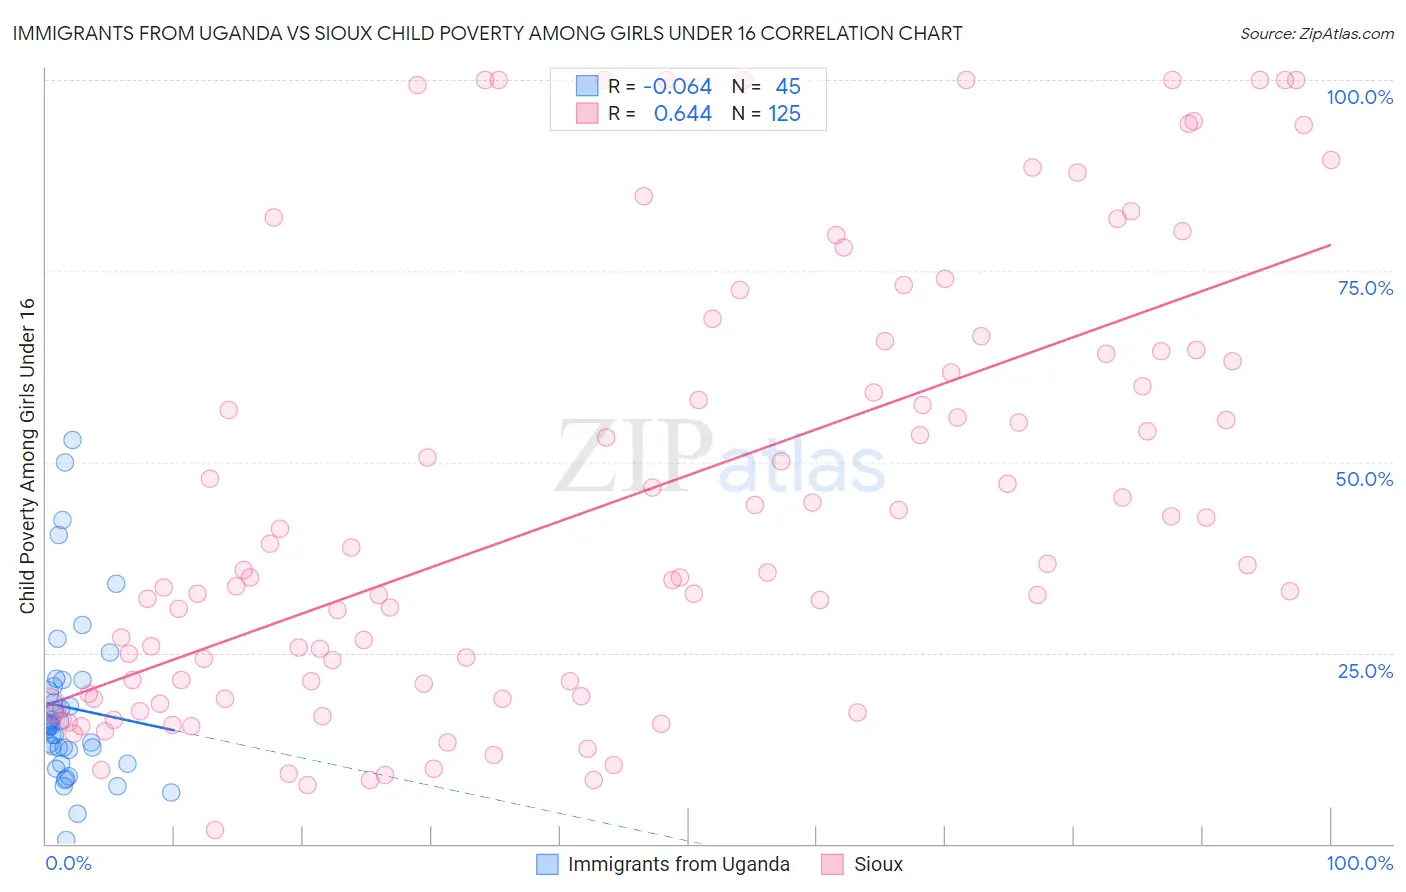
Immigrants from Uganda vs Sioux Child Poverty Among Girls Under 16 Correlation Chart
The statistical analysis conducted on geographies consisting of 125,221,716 people shows a slight negative correlation between the proportion of Immigrants from Uganda and poverty level among girls under the age of 16 in the United States with a correlation coefficient (R) of -0.064 and weighted average of 16.8%. Similarly, the statistical analysis conducted on geographies consisting of 231,838,275 people shows a significant positive correlation between the proportion of Sioux and poverty level among girls under the age of 16 in the United States with a correlation coefficient (R) of 0.644 and weighted average of 25.6%, a difference of 51.8%.
Child Poverty Among Girls Under 16 Correlation Summary
| Measurement | Immigrants from Uganda | Sioux |
| Minimum | 0.57% | 1.8% |
| Maximum | 52.8% | 100.0% |
| Range | 52.2% | 98.2% |
| Mean | 17.8% | 45.0% |
| Median | 15.5% | 35.9% |
| Interquartile 25% (IQ1) | 11.4% | 19.5% |
| Interquartile 75% (IQ3) | 21.0% | 64.6% |
| Interquartile Range (IQR) | 9.7% | 45.1% |
| Standard Deviation (Sample) | 11.1% | 28.8% |
| Standard Deviation (Population) | 11.0% | 28.7% |
Similar Demographics by Child Poverty Among Girls Under 16
Demographics Similar to Immigrants from Uganda by Child Poverty Among Girls Under 16
In terms of child poverty among girls under 16, the demographic groups most similar to Immigrants from Uganda are Immigrants from the Azores (16.8%, a difference of 0.010%), Kenyan (16.8%, a difference of 0.13%), Immigrants from Bosnia and Herzegovina (16.8%, a difference of 0.17%), Aleut (16.9%, a difference of 0.34%), and Spanish (16.9%, a difference of 0.36%).
| Demographics | Rating | Rank | Child Poverty Among Girls Under 16 |
| Immigrants | Uruguay | 35.6 /100 | #185 | Fair 16.7% |
| South American Indians | 35.0 /100 | #186 | Fair 16.8% |
| Immigrants | Morocco | 34.6 /100 | #187 | Fair 16.8% |
| Arabs | 34.5 /100 | #188 | Fair 16.8% |
| Immigrants | Bosnia and Herzegovina | 32.5 /100 | #189 | Fair 16.8% |
| Kenyans | 32.3 /100 | #190 | Fair 16.8% |
| Immigrants | Azores | 31.3 /100 | #191 | Fair 16.8% |
| Immigrants | Uganda | 31.3 /100 | #192 | Fair 16.8% |
| Aleuts | 28.7 /100 | #193 | Fair 16.9% |
| Spanish | 28.6 /100 | #194 | Fair 16.9% |
| Immigrants | Costa Rica | 25.6 /100 | #195 | Fair 17.0% |
| Celtics | 25.2 /100 | #196 | Fair 17.0% |
| Spaniards | 24.9 /100 | #197 | Fair 17.0% |
| Immigrants | Lebanon | 22.6 /100 | #198 | Fair 17.1% |
| Immigrants | Afghanistan | 22.4 /100 | #199 | Fair 17.1% |
Demographics Similar to Sioux by Child Poverty Among Girls Under 16
In terms of child poverty among girls under 16, the demographic groups most similar to Sioux are Yup'ik (25.8%, a difference of 0.93%), Pueblo (25.2%, a difference of 1.5%), Menominee (25.0%, a difference of 2.2%), Cheyenne (26.3%, a difference of 2.7%), and Crow (26.4%, a difference of 3.1%).
| Demographics | Rating | Rank | Child Poverty Among Girls Under 16 |
| Kiowa | 0.0 /100 | #329 | Tragic 23.7% |
| Immigrants | Dominican Republic | 0.0 /100 | #330 | Tragic 23.8% |
| Apache | 0.0 /100 | #331 | Tragic 23.8% |
| Natives/Alaskans | 0.0 /100 | #332 | Tragic 24.0% |
| Blacks/African Americans | 0.0 /100 | #333 | Tragic 24.7% |
| Menominee | 0.0 /100 | #334 | Tragic 25.0% |
| Pueblo | 0.0 /100 | #335 | Tragic 25.2% |
| Sioux | 0.0 /100 | #336 | Tragic 25.6% |
| Yup'ik | 0.0 /100 | #337 | Tragic 25.8% |
| Cheyenne | 0.0 /100 | #338 | Tragic 26.3% |
| Crow | 0.0 /100 | #339 | Tragic 26.4% |
| Yuman | 0.0 /100 | #340 | Tragic 27.1% |
| Hopi | 0.0 /100 | #341 | Tragic 27.9% |
| Pima | 0.0 /100 | #342 | Tragic 28.2% |
| Immigrants | Yemen | 0.0 /100 | #343 | Tragic 29.5% |