Immigrants from Uganda vs French Canadian Unemployment
COMPARE
Immigrants from Uganda
French Canadian
Unemployment
Unemployment Comparison
Immigrants from Uganda
French Canadians
5.3%
UNEMPLOYMENT
37.8/ 100
METRIC RATING
186th/ 347
METRIC RANK
4.9%
UNEMPLOYMENT
99.3/ 100
METRIC RATING
50th/ 347
METRIC RANK
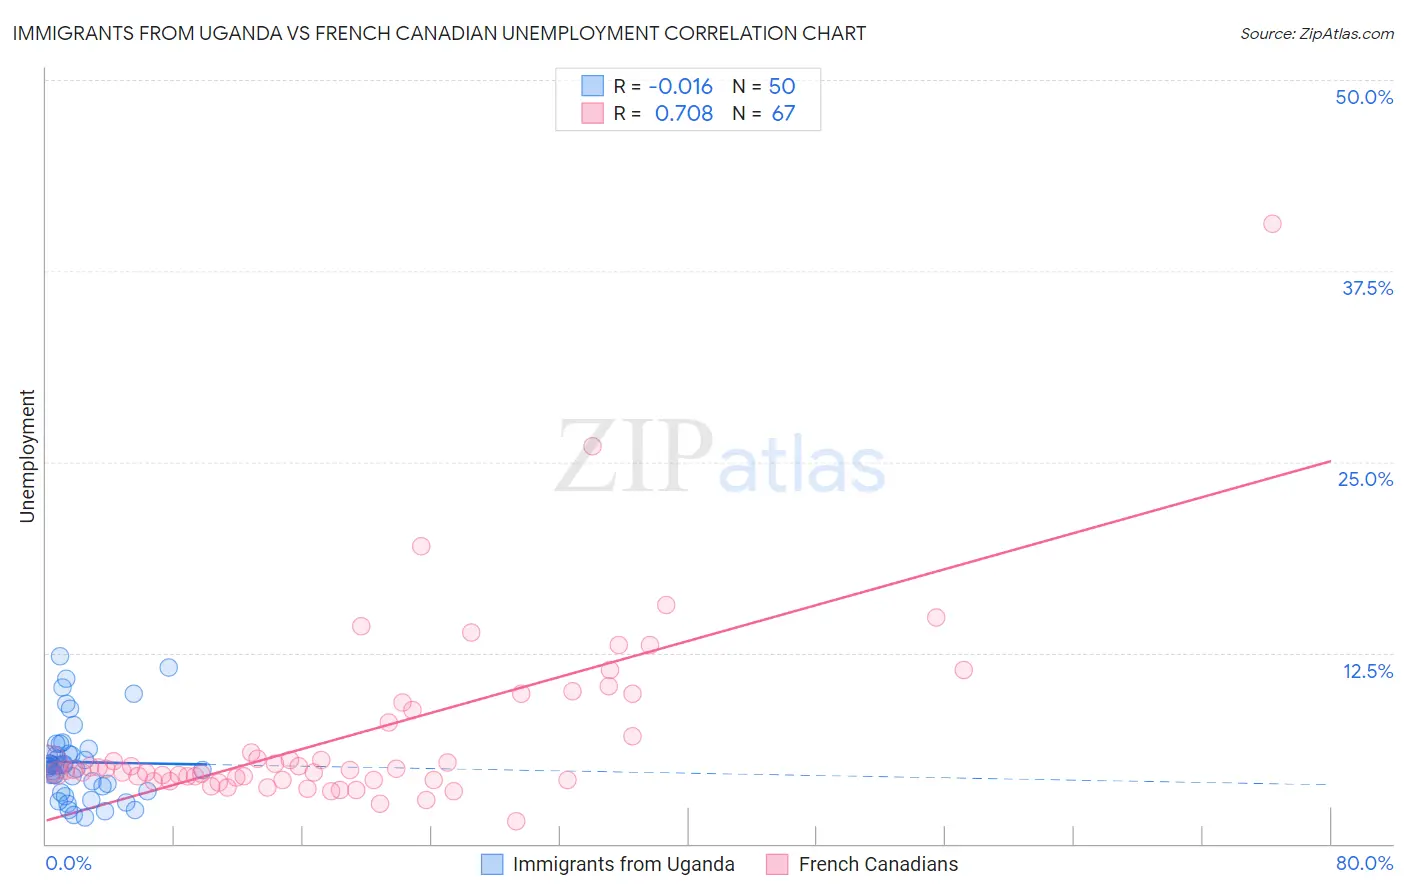
Immigrants from Uganda vs French Canadian Unemployment Correlation Chart
The statistical analysis conducted on geographies consisting of 125,961,312 people shows no correlation between the proportion of Immigrants from Uganda and unemployment in the United States with a correlation coefficient (R) of -0.016 and weighted average of 5.3%. Similarly, the statistical analysis conducted on geographies consisting of 500,867,403 people shows a strong positive correlation between the proportion of French Canadians and unemployment in the United States with a correlation coefficient (R) of 0.708 and weighted average of 4.9%, a difference of 9.0%.
Unemployment Correlation Summary
| Measurement | Immigrants from Uganda | French Canadian |
| Minimum | 1.7% | 1.5% |
| Maximum | 12.2% | 40.6% |
| Range | 10.5% | 39.1% |
| Mean | 5.3% | 7.1% |
| Median | 5.1% | 4.9% |
| Interquartile 25% (IQ1) | 3.7% | 4.2% |
| Interquartile 75% (IQ3) | 5.9% | 8.7% |
| Interquartile Range (IQR) | 2.2% | 4.5% |
| Standard Deviation (Sample) | 2.5% | 6.0% |
| Standard Deviation (Population) | 2.5% | 6.0% |
Similar Demographics by Unemployment
Demographics Similar to Immigrants from Uganda by Unemployment
In terms of unemployment, the demographic groups most similar to Immigrants from Uganda are Costa Rican (5.3%, a difference of 0.030%), Alsatian (5.3%, a difference of 0.050%), Immigrants from Thailand (5.3%, a difference of 0.070%), Assyrian/Chaldean/Syriac (5.3%, a difference of 0.090%), and Brazilian (5.3%, a difference of 0.15%).
| Demographics | Rating | Rank | Unemployment |
| Malaysians | 46.8 /100 | #179 | Average 5.3% |
| Immigrants | Greece | 45.0 /100 | #180 | Average 5.3% |
| Albanians | 43.5 /100 | #181 | Average 5.3% |
| Spaniards | 42.2 /100 | #182 | Average 5.3% |
| Brazilians | 40.2 /100 | #183 | Average 5.3% |
| Assyrians/Chaldeans/Syriacs | 39.2 /100 | #184 | Fair 5.3% |
| Immigrants | Thailand | 38.9 /100 | #185 | Fair 5.3% |
| Immigrants | Uganda | 37.8 /100 | #186 | Fair 5.3% |
| Costa Ricans | 37.4 /100 | #187 | Fair 5.3% |
| Alsatians | 37.0 /100 | #188 | Fair 5.3% |
| Immigrants | Belarus | 35.6 /100 | #189 | Fair 5.3% |
| Arabs | 35.3 /100 | #190 | Fair 5.3% |
| Somalis | 34.0 /100 | #191 | Fair 5.3% |
| South Americans | 33.9 /100 | #192 | Fair 5.3% |
| Immigrants | Somalia | 33.8 /100 | #193 | Fair 5.3% |
Demographics Similar to French Canadians by Unemployment
In terms of unemployment, the demographic groups most similar to French Canadians are Immigrants from South Central Asia (4.9%, a difference of 0.020%), Immigrants from Scotland (4.9%, a difference of 0.030%), Immigrants from Belgium (4.9%, a difference of 0.16%), White/Caucasian (4.9%, a difference of 0.17%), and Immigrants from Zimbabwe (4.9%, a difference of 0.20%).
| Demographics | Rating | Rank | Unemployment |
| Yugoslavians | 99.5 /100 | #43 | Exceptional 4.8% |
| Austrians | 99.5 /100 | #44 | Exceptional 4.8% |
| French | 99.5 /100 | #45 | Exceptional 4.8% |
| Immigrants | Nepal | 99.4 /100 | #46 | Exceptional 4.8% |
| Immigrants | Taiwan | 99.4 /100 | #47 | Exceptional 4.8% |
| Immigrants | Scotland | 99.3 /100 | #48 | Exceptional 4.9% |
| Immigrants | South Central Asia | 99.3 /100 | #49 | Exceptional 4.9% |
| French Canadians | 99.3 /100 | #50 | Exceptional 4.9% |
| Immigrants | Belgium | 99.2 /100 | #51 | Exceptional 4.9% |
| Whites/Caucasians | 99.2 /100 | #52 | Exceptional 4.9% |
| Immigrants | Zimbabwe | 99.2 /100 | #53 | Exceptional 4.9% |
| Eastern Europeans | 99.2 /100 | #54 | Exceptional 4.9% |
| Australians | 99.2 /100 | #55 | Exceptional 4.9% |
| Celtics | 99.1 /100 | #56 | Exceptional 4.9% |
| Immigrants | Singapore | 99.1 /100 | #57 | Exceptional 4.9% |