Bermudan vs Yuman Male Poverty
COMPARE
Bermudan
Yuman
Male Poverty
Male Poverty Comparison
Bermudans
Yuman
12.2%
MALE POVERTY
2.4/ 100
METRIC RATING
219th/ 347
METRIC RANK
19.5%
MALE POVERTY
0.0/ 100
METRIC RATING
339th/ 347
METRIC RANK
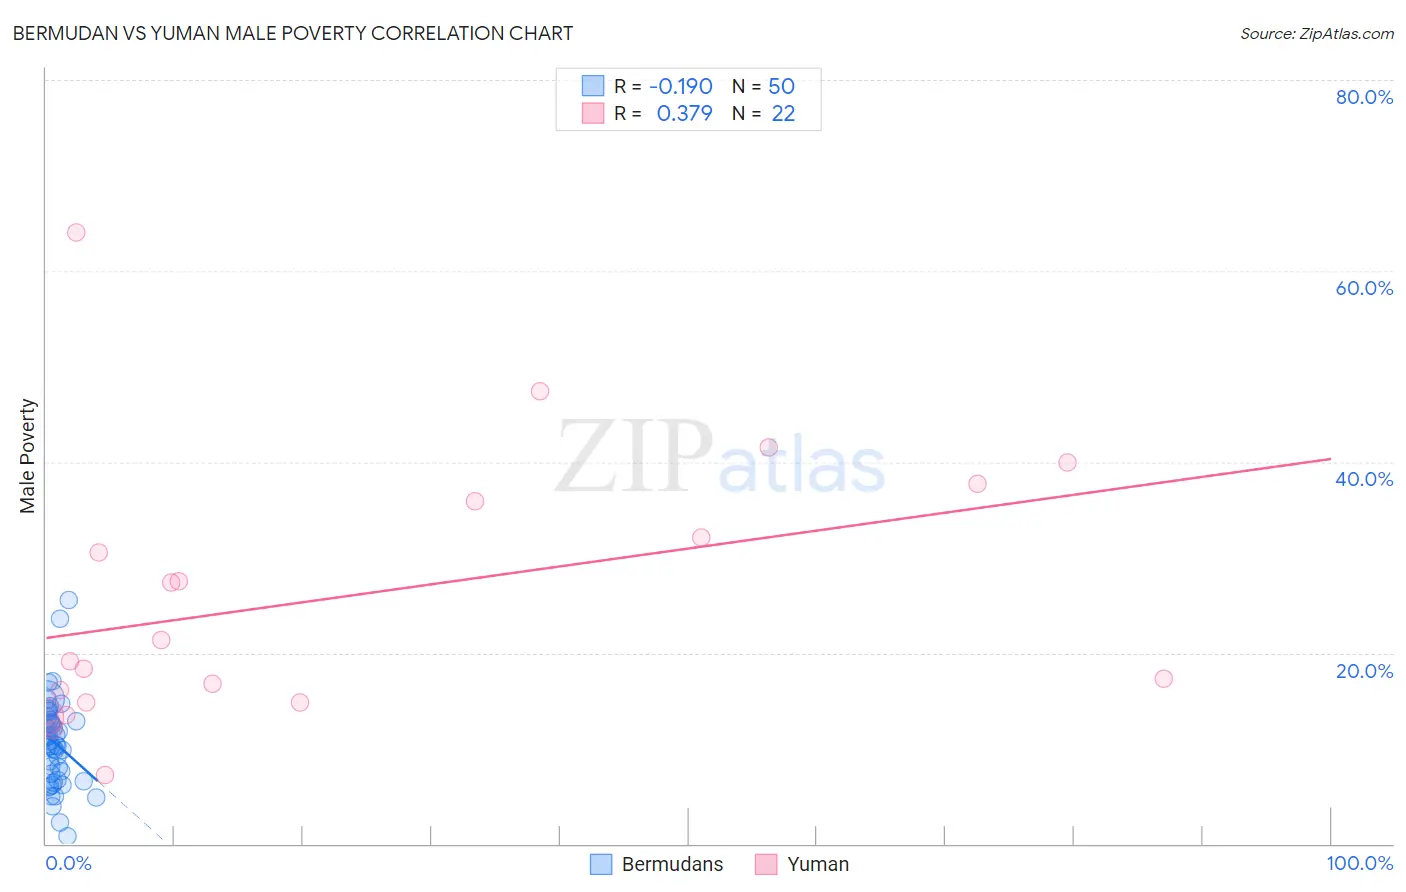
Bermudan vs Yuman Male Poverty Correlation Chart
The statistical analysis conducted on geographies consisting of 55,715,607 people shows a poor negative correlation between the proportion of Bermudans and poverty level among males in the United States with a correlation coefficient (R) of -0.190 and weighted average of 12.2%. Similarly, the statistical analysis conducted on geographies consisting of 40,667,603 people shows a mild positive correlation between the proportion of Yuman and poverty level among males in the United States with a correlation coefficient (R) of 0.379 and weighted average of 19.5%, a difference of 60.2%.
Male Poverty Correlation Summary
| Measurement | Bermudan | Yuman |
| Minimum | 0.81% | 7.2% |
| Maximum | 25.6% | 64.1% |
| Range | 24.8% | 56.9% |
| Mean | 10.5% | 25.8% |
| Median | 10.3% | 20.2% |
| Interquartile 25% (IQ1) | 6.7% | 14.8% |
| Interquartile 75% (IQ3) | 12.9% | 35.9% |
| Interquartile Range (IQR) | 6.2% | 21.1% |
| Standard Deviation (Sample) | 4.7% | 14.1% |
| Standard Deviation (Population) | 4.7% | 13.7% |
Similar Demographics by Male Poverty
Demographics Similar to Bermudans by Male Poverty
In terms of male poverty, the demographic groups most similar to Bermudans are Immigrants from Eritrea (12.2%, a difference of 0.020%), German Russian (12.2%, a difference of 0.070%), Immigrants from Thailand (12.2%, a difference of 0.090%), Immigrants from Cambodia (12.2%, a difference of 0.10%), and Immigrants from Uzbekistan (12.2%, a difference of 0.18%).
| Demographics | Rating | Rank | Male Poverty |
| Americans | 3.2 /100 | #212 | Tragic 12.1% |
| Immigrants | Nonimmigrants | 3.1 /100 | #213 | Tragic 12.1% |
| Japanese | 2.7 /100 | #214 | Tragic 12.2% |
| Immigrants | Uzbekistan | 2.6 /100 | #215 | Tragic 12.2% |
| Immigrants | Cambodia | 2.5 /100 | #216 | Tragic 12.2% |
| Immigrants | Thailand | 2.5 /100 | #217 | Tragic 12.2% |
| German Russians | 2.5 /100 | #218 | Tragic 12.2% |
| Bermudans | 2.4 /100 | #219 | Tragic 12.2% |
| Immigrants | Eritrea | 2.4 /100 | #220 | Tragic 12.2% |
| Ugandans | 2.2 /100 | #221 | Tragic 12.2% |
| Immigrants | Africa | 2.1 /100 | #222 | Tragic 12.2% |
| Immigrants | Micronesia | 2.1 /100 | #223 | Tragic 12.2% |
| Immigrants | Nigeria | 1.6 /100 | #224 | Tragic 12.3% |
| Osage | 1.5 /100 | #225 | Tragic 12.3% |
| Nigerians | 1.4 /100 | #226 | Tragic 12.3% |
Demographics Similar to Yuman by Male Poverty
In terms of male poverty, the demographic groups most similar to Yuman are Crow (19.1%, a difference of 2.2%), Immigrants from Yemen (20.1%, a difference of 3.1%), Lumbee (20.2%, a difference of 3.4%), Pima (20.4%, a difference of 4.2%), and Yup'ik (20.4%, a difference of 4.3%).
| Demographics | Rating | Rank | Male Poverty |
| Houma | 0.0 /100 | #332 | Tragic 16.7% |
| Natives/Alaskans | 0.0 /100 | #333 | Tragic 16.9% |
| Cheyenne | 0.0 /100 | #334 | Tragic 17.6% |
| Apache | 0.0 /100 | #335 | Tragic 17.7% |
| Pueblo | 0.0 /100 | #336 | Tragic 18.5% |
| Sioux | 0.0 /100 | #337 | Tragic 18.7% |
| Crow | 0.0 /100 | #338 | Tragic 19.1% |
| Yuman | 0.0 /100 | #339 | Tragic 19.5% |
| Immigrants | Yemen | 0.0 /100 | #340 | Tragic 20.1% |
| Lumbee | 0.0 /100 | #341 | Tragic 20.2% |
| Pima | 0.0 /100 | #342 | Tragic 20.4% |
| Yup'ik | 0.0 /100 | #343 | Tragic 20.4% |
| Hopi | 0.0 /100 | #344 | Tragic 20.8% |
| Puerto Ricans | 0.0 /100 | #345 | Tragic 22.0% |
| Navajo | 0.0 /100 | #346 | Tragic 22.3% |