Immigrants from Taiwan vs Immigrants from England Householder Income Over 65 years
COMPARE
Immigrants from Taiwan
Immigrants from England
Householder Income Over 65 years
Householder Income Over 65 years Comparison
Immigrants from Taiwan
Immigrants from England
$77,051
HOUSEHOLDER INCOME OVER 65 YEARS
100.0/ 100
METRIC RATING
3rd/ 347
METRIC RANK
$65,715
HOUSEHOLDER INCOME OVER 65 YEARS
99.3/ 100
METRIC RATING
65th/ 347
METRIC RANK
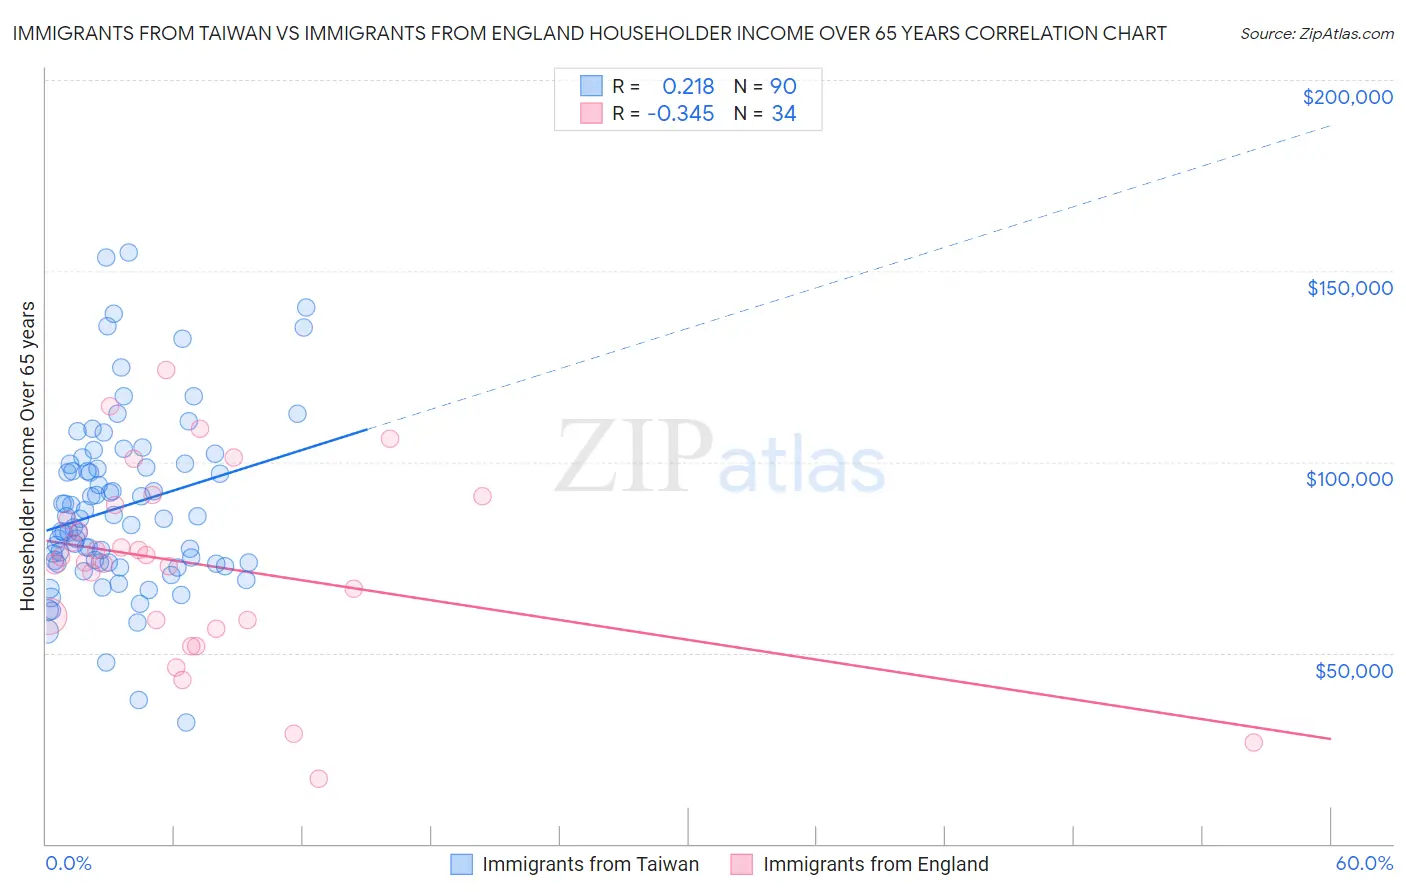
Immigrants from Taiwan vs Immigrants from England Householder Income Over 65 years Correlation Chart
The statistical analysis conducted on geographies consisting of 297,705,032 people shows a weak positive correlation between the proportion of Immigrants from Taiwan and household income with householder over the age of 65 in the United States with a correlation coefficient (R) of 0.218 and weighted average of $77,051. Similarly, the statistical analysis conducted on geographies consisting of 391,074,027 people shows a mild negative correlation between the proportion of Immigrants from England and household income with householder over the age of 65 in the United States with a correlation coefficient (R) of -0.345 and weighted average of $65,715, a difference of 17.2%.
Householder Income Over 65 years Correlation Summary
| Measurement | Immigrants from Taiwan | Immigrants from England |
| Minimum | $31,867 | $16,875 |
| Maximum | $154,709 | $124,064 |
| Range | $122,842 | $107,189 |
| Mean | $88,175 | $72,987 |
| Median | $85,060 | $74,315 |
| Interquartile 25% (IQ1) | $73,583 | $58,438 |
| Interquartile 75% (IQ3) | $99,353 | $88,575 |
| Interquartile Range (IQR) | $25,770 | $30,137 |
| Standard Deviation (Sample) | $23,073 | $24,739 |
| Standard Deviation (Population) | $22,945 | $24,372 |
Similar Demographics by Householder Income Over 65 years
Demographics Similar to Immigrants from Taiwan by Householder Income Over 65 years
In terms of householder income over 65 years, the demographic groups most similar to Immigrants from Taiwan are Filipino ($76,686, a difference of 0.48%), Iranian ($77,429, a difference of 0.49%), Chinese ($77,465, a difference of 0.54%), Immigrants from Iran ($75,081, a difference of 2.6%), and Bolivian ($74,245, a difference of 3.8%).
| Demographics | Rating | Rank | Householder Income Over 65 years |
| Chinese | 100.0 /100 | #1 | Exceptional $77,465 |
| Iranians | 100.0 /100 | #2 | Exceptional $77,429 |
| Immigrants | Taiwan | 100.0 /100 | #3 | Exceptional $77,051 |
| Filipinos | 100.0 /100 | #4 | Exceptional $76,686 |
| Immigrants | Iran | 100.0 /100 | #5 | Exceptional $75,081 |
| Bolivians | 100.0 /100 | #6 | Exceptional $74,245 |
| Immigrants | Bolivia | 100.0 /100 | #7 | Exceptional $73,434 |
| Immigrants | Singapore | 100.0 /100 | #8 | Exceptional $72,963 |
| Immigrants | India | 100.0 /100 | #9 | Exceptional $72,804 |
| Bhutanese | 100.0 /100 | #10 | Exceptional $72,288 |
| Thais | 100.0 /100 | #11 | Exceptional $72,099 |
| Cypriots | 100.0 /100 | #12 | Exceptional $71,714 |
| Immigrants | Hong Kong | 100.0 /100 | #13 | Exceptional $71,567 |
| Burmese | 100.0 /100 | #14 | Exceptional $71,139 |
| Native Hawaiians | 100.0 /100 | #15 | Exceptional $71,021 |
Demographics Similar to Immigrants from England by Householder Income Over 65 years
In terms of householder income over 65 years, the demographic groups most similar to Immigrants from England are South African ($65,652, a difference of 0.10%), Zimbabwean ($65,854, a difference of 0.21%), Marshallese ($65,874, a difference of 0.24%), Immigrants from Malaysia ($65,497, a difference of 0.33%), and Egyptian ($65,441, a difference of 0.42%).
| Demographics | Rating | Rank | Householder Income Over 65 years |
| Immigrants | Philippines | 99.6 /100 | #58 | Exceptional $66,161 |
| Immigrants | Norway | 99.5 /100 | #59 | Exceptional $66,118 |
| Immigrants | Lithuania | 99.5 /100 | #60 | Exceptional $66,087 |
| Maltese | 99.5 /100 | #61 | Exceptional $66,027 |
| Immigrants | Sierra Leone | 99.5 /100 | #62 | Exceptional $66,009 |
| Marshallese | 99.4 /100 | #63 | Exceptional $65,874 |
| Zimbabweans | 99.4 /100 | #64 | Exceptional $65,854 |
| Immigrants | England | 99.3 /100 | #65 | Exceptional $65,715 |
| South Africans | 99.3 /100 | #66 | Exceptional $65,652 |
| Immigrants | Malaysia | 99.1 /100 | #67 | Exceptional $65,497 |
| Egyptians | 99.1 /100 | #68 | Exceptional $65,441 |
| Samoans | 99.1 /100 | #69 | Exceptional $65,427 |
| Mongolians | 99.0 /100 | #70 | Exceptional $65,326 |
| Greeks | 98.9 /100 | #71 | Exceptional $65,306 |
| Argentineans | 98.9 /100 | #72 | Exceptional $65,246 |