Immigrants from South Eastern Asia vs French Married-Couple Family Poverty
COMPARE
Immigrants from South Eastern Asia
French
Married-Couple Family Poverty
Married-Couple Family Poverty Comparison
Immigrants from South Eastern Asia
French
5.1%
MARRIED-COUPLE FAMILY POVERTY
70.4/ 100
METRIC RATING
158th/ 347
METRIC RANK
4.3%
MARRIED-COUPLE FAMILY POVERTY
99.7/ 100
METRIC RATING
55th/ 347
METRIC RANK
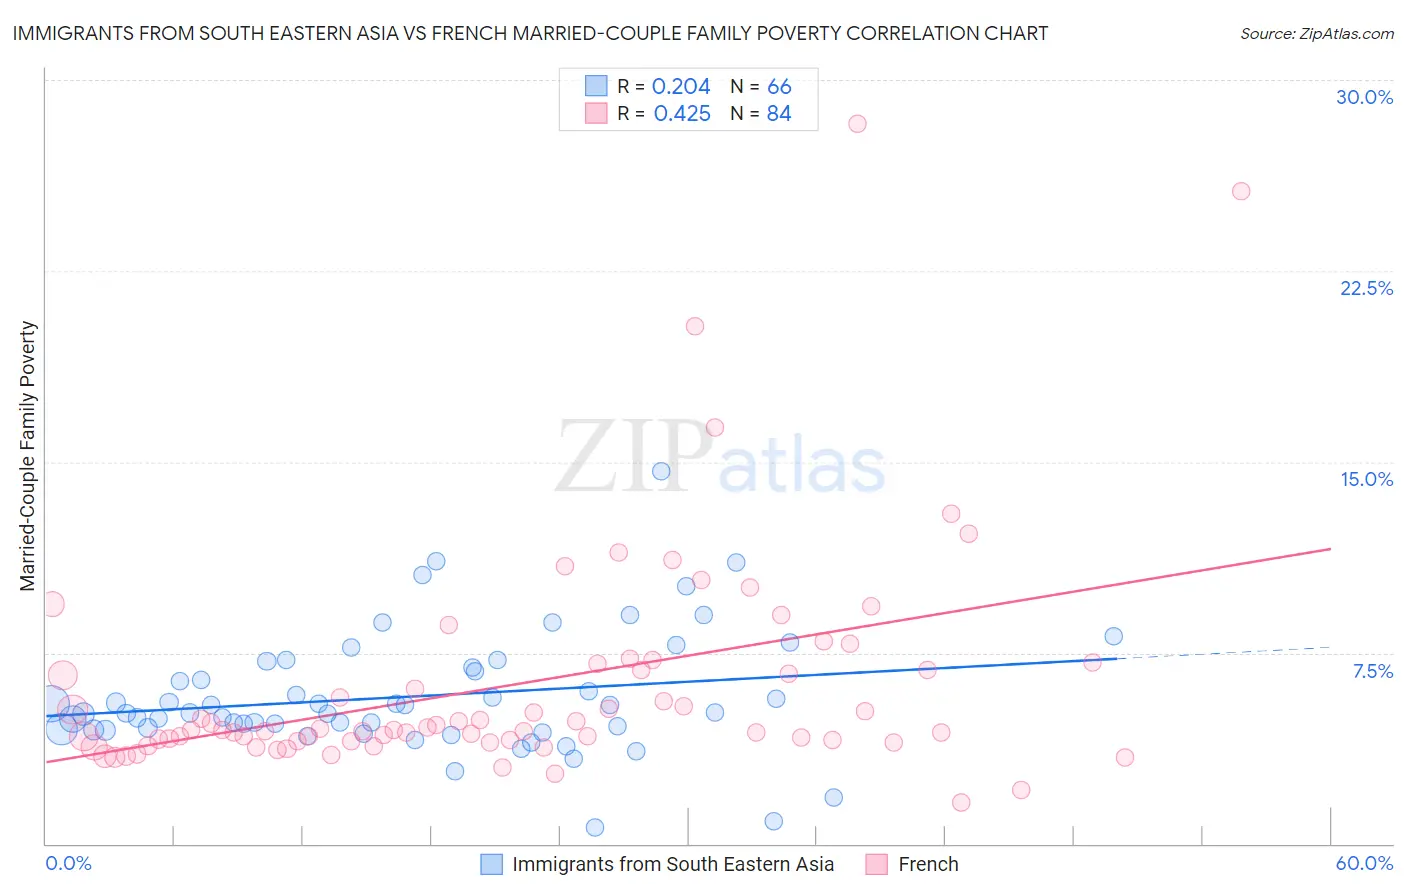
Immigrants from South Eastern Asia vs French Married-Couple Family Poverty Correlation Chart
The statistical analysis conducted on geographies consisting of 504,926,469 people shows a weak positive correlation between the proportion of Immigrants from South Eastern Asia and poverty level among married-couple families in the United States with a correlation coefficient (R) of 0.204 and weighted average of 5.1%. Similarly, the statistical analysis conducted on geographies consisting of 557,631,168 people shows a moderate positive correlation between the proportion of French and poverty level among married-couple families in the United States with a correlation coefficient (R) of 0.425 and weighted average of 4.3%, a difference of 17.2%.
Married-Couple Family Poverty Correlation Summary
| Measurement | Immigrants from South Eastern Asia | French |
| Minimum | 0.63% | 1.6% |
| Maximum | 14.6% | 28.3% |
| Range | 14.0% | 26.7% |
| Mean | 5.8% | 6.3% |
| Median | 5.1% | 4.5% |
| Interquartile 25% (IQ1) | 4.5% | 4.0% |
| Interquartile 75% (IQ3) | 6.9% | 6.9% |
| Interquartile Range (IQR) | 2.4% | 2.9% |
| Standard Deviation (Sample) | 2.4% | 4.5% |
| Standard Deviation (Population) | 2.4% | 4.5% |
Similar Demographics by Married-Couple Family Poverty
Demographics Similar to Immigrants from South Eastern Asia by Married-Couple Family Poverty
In terms of married-couple family poverty, the demographic groups most similar to Immigrants from South Eastern Asia are Immigrants from Saudi Arabia (5.1%, a difference of 0.0%), Argentinean (5.1%, a difference of 0.050%), Pennsylvania German (5.1%, a difference of 0.26%), Sri Lankan (5.1%, a difference of 0.27%), and Immigrants from Ethiopia (5.1%, a difference of 0.31%).
| Demographics | Rating | Rank | Married-Couple Family Poverty |
| Immigrants | Cameroon | 77.3 /100 | #151 | Good 5.0% |
| Albanians | 77.2 /100 | #152 | Good 5.0% |
| Immigrants | Kuwait | 76.3 /100 | #153 | Good 5.0% |
| Delaware | 73.7 /100 | #154 | Good 5.1% |
| Immigrants | Ethiopia | 72.4 /100 | #155 | Good 5.1% |
| Sri Lankans | 72.2 /100 | #156 | Good 5.1% |
| Argentineans | 70.7 /100 | #157 | Good 5.1% |
| Immigrants | South Eastern Asia | 70.4 /100 | #158 | Good 5.1% |
| Immigrants | Saudi Arabia | 70.3 /100 | #159 | Good 5.1% |
| Pennsylvania Germans | 68.5 /100 | #160 | Good 5.1% |
| Ethiopians | 68.1 /100 | #161 | Good 5.1% |
| Immigrants | Jordan | 66.5 /100 | #162 | Good 5.1% |
| Sierra Leoneans | 64.1 /100 | #163 | Good 5.1% |
| Hawaiians | 62.3 /100 | #164 | Good 5.1% |
| Immigrants | Malaysia | 62.2 /100 | #165 | Good 5.1% |
Demographics Similar to French by Married-Couple Family Poverty
In terms of married-couple family poverty, the demographic groups most similar to French are Austrian (4.3%, a difference of 0.020%), Immigrants from Zimbabwe (4.3%, a difference of 0.16%), Immigrants from Netherlands (4.3%, a difference of 0.16%), Czechoslovakian (4.4%, a difference of 0.24%), and Welsh (4.3%, a difference of 0.29%).
| Demographics | Rating | Rank | Married-Couple Family Poverty |
| Australians | 99.7 /100 | #48 | Exceptional 4.3% |
| Turks | 99.7 /100 | #49 | Exceptional 4.3% |
| Burmese | 99.7 /100 | #50 | Exceptional 4.3% |
| Immigrants | Lithuania | 99.7 /100 | #51 | Exceptional 4.3% |
| Russians | 99.7 /100 | #52 | Exceptional 4.3% |
| Welsh | 99.7 /100 | #53 | Exceptional 4.3% |
| Austrians | 99.7 /100 | #54 | Exceptional 4.3% |
| French | 99.7 /100 | #55 | Exceptional 4.3% |
| Immigrants | Zimbabwe | 99.7 /100 | #56 | Exceptional 4.3% |
| Immigrants | Netherlands | 99.7 /100 | #57 | Exceptional 4.3% |
| Czechoslovakians | 99.7 /100 | #58 | Exceptional 4.4% |
| Immigrants | Sweden | 99.6 /100 | #59 | Exceptional 4.4% |
| Tlingit-Haida | 99.6 /100 | #60 | Exceptional 4.4% |
| Okinawans | 99.6 /100 | #61 | Exceptional 4.4% |
| Immigrants | Australia | 99.6 /100 | #62 | Exceptional 4.4% |