Immigrants from Somalia vs Immigrants from Yemen Unemployment Among Seniors over 65 years
COMPARE
Immigrants from Somalia
Immigrants from Yemen
Unemployment Among Seniors over 65 years
Unemployment Among Seniors over 65 years Comparison
Immigrants from Somalia
Immigrants from Yemen
5.2%
UNEMPLOYMENT AMONG SENIORS OVER 65 YEARS
44.0/ 100
METRIC RATING
179th/ 347
METRIC RANK
8.2%
UNEMPLOYMENT AMONG SENIORS OVER 65 YEARS
0.0/ 100
METRIC RATING
345th/ 347
METRIC RANK
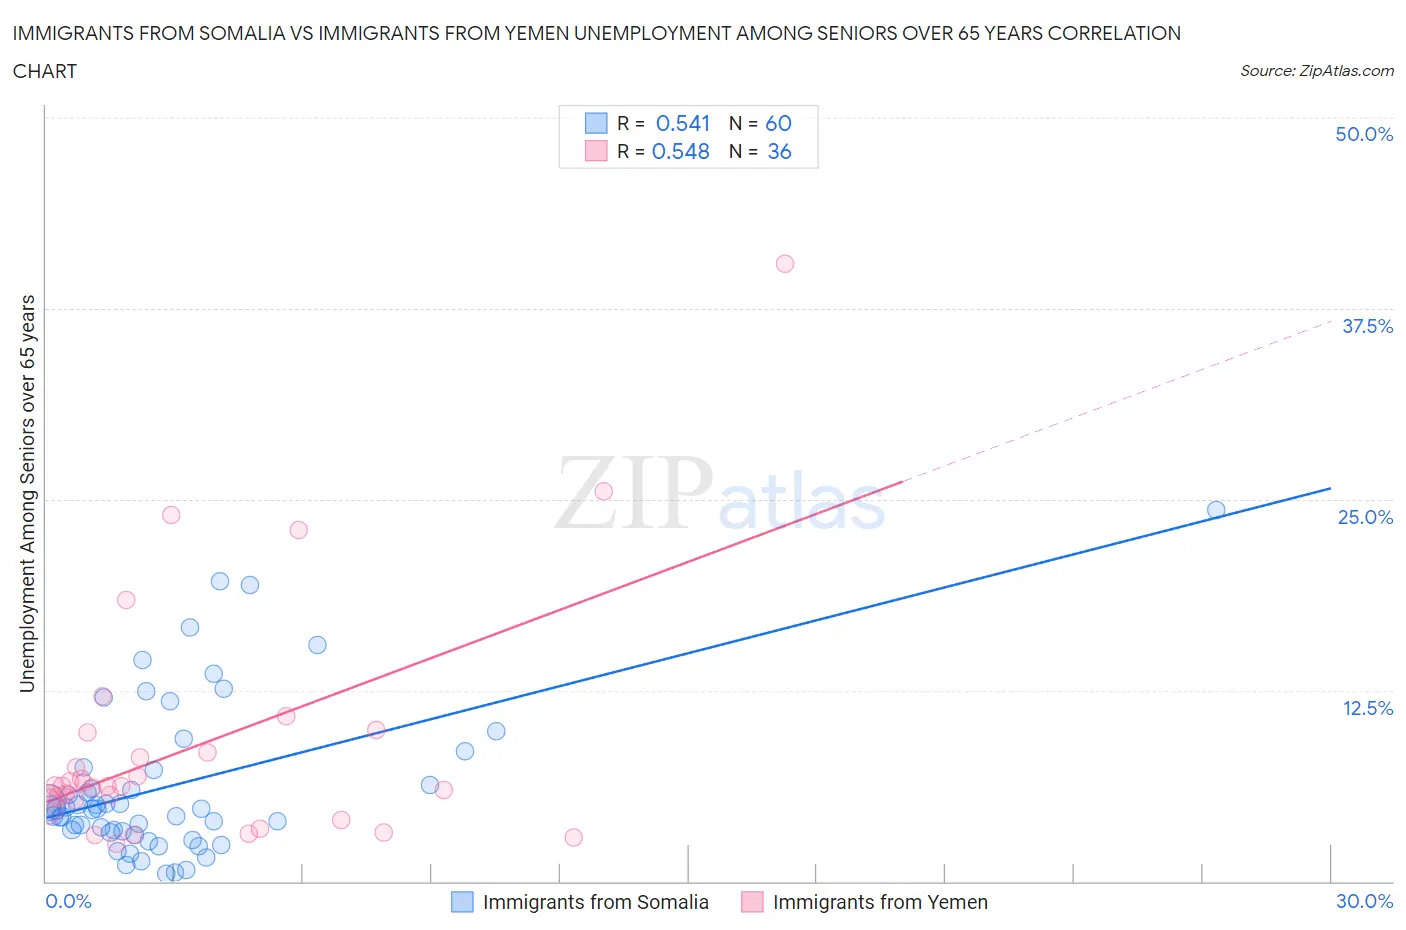
Immigrants from Somalia vs Immigrants from Yemen Unemployment Among Seniors over 65 years Correlation Chart
The statistical analysis conducted on geographies consisting of 88,494,668 people shows a substantial positive correlation between the proportion of Immigrants from Somalia and unemployment rate amomg seniors over the age of 65 in the United States with a correlation coefficient (R) of 0.541 and weighted average of 5.2%. Similarly, the statistical analysis conducted on geographies consisting of 80,179,365 people shows a substantial positive correlation between the proportion of Immigrants from Yemen and unemployment rate amomg seniors over the age of 65 in the United States with a correlation coefficient (R) of 0.548 and weighted average of 8.2%, a difference of 59.0%.
Unemployment Among Seniors over 65 years Correlation Summary
| Measurement | Immigrants from Somalia | Immigrants from Yemen |
| Minimum | 0.50% | 2.4% |
| Maximum | 24.3% | 40.4% |
| Range | 23.8% | 38.0% |
| Mean | 6.3% | 8.9% |
| Median | 4.7% | 6.2% |
| Interquartile 25% (IQ1) | 3.2% | 5.1% |
| Interquartile 75% (IQ3) | 7.4% | 9.1% |
| Interquartile Range (IQR) | 4.1% | 3.9% |
| Standard Deviation (Sample) | 5.1% | 7.9% |
| Standard Deviation (Population) | 5.1% | 7.8% |
Similar Demographics by Unemployment Among Seniors over 65 years
Demographics Similar to Immigrants from Somalia by Unemployment Among Seniors over 65 years
In terms of unemployment among seniors over 65 years, the demographic groups most similar to Immigrants from Somalia are Russian (5.2%, a difference of 0.010%), Immigrants from Belgium (5.2%, a difference of 0.020%), Immigrants from Italy (5.2%, a difference of 0.020%), Panamanian (5.2%, a difference of 0.030%), and Icelander (5.2%, a difference of 0.060%).
| Demographics | Rating | Rank | Unemployment Among Seniors over 65 years |
| Immigrants | Ireland | 53.2 /100 | #172 | Average 5.1% |
| Immigrants | Spain | 51.7 /100 | #173 | Average 5.1% |
| Spanish Americans | 50.0 /100 | #174 | Average 5.1% |
| Immigrants | Eastern Europe | 49.8 /100 | #175 | Average 5.1% |
| Indians (Asian) | 46.6 /100 | #176 | Average 5.2% |
| Icelanders | 45.9 /100 | #177 | Average 5.2% |
| Immigrants | Belgium | 44.8 /100 | #178 | Average 5.2% |
| Immigrants | Somalia | 44.0 /100 | #179 | Average 5.2% |
| Russians | 43.6 /100 | #180 | Average 5.2% |
| Immigrants | Italy | 43.5 /100 | #181 | Average 5.2% |
| Panamanians | 43.0 /100 | #182 | Average 5.2% |
| Immigrants | Western Asia | 42.1 /100 | #183 | Average 5.2% |
| Immigrants | Serbia | 41.6 /100 | #184 | Average 5.2% |
| Immigrants | Iran | 36.0 /100 | #185 | Fair 5.2% |
| Americans | 35.1 /100 | #186 | Fair 5.2% |
Demographics Similar to Immigrants from Yemen by Unemployment Among Seniors over 65 years
In terms of unemployment among seniors over 65 years, the demographic groups most similar to Immigrants from Yemen are Yup'ik (9.1%, a difference of 11.4%), Alaskan Athabascan (7.0%, a difference of 16.4%), Tlingit-Haida (6.8%, a difference of 20.7%), Navajo (6.7%, a difference of 22.3%), and Yakama (6.7%, a difference of 22.9%).
| Demographics | Rating | Rank | Unemployment Among Seniors over 65 years |
| Immigrants | Dominican Republic | 0.0 /100 | #333 | Tragic 6.0% |
| Tohono O'odham | 0.0 /100 | #334 | Tragic 6.1% |
| Immigrants | Armenia | 0.0 /100 | #335 | Tragic 6.2% |
| Pima | 0.0 /100 | #336 | Tragic 6.3% |
| Alaska Natives | 0.0 /100 | #337 | Tragic 6.3% |
| Immigrants | Azores | 0.0 /100 | #338 | Tragic 6.3% |
| Paiute | 0.0 /100 | #339 | Tragic 6.3% |
| Ute | 0.0 /100 | #340 | Tragic 6.3% |
| Yakama | 0.0 /100 | #341 | Tragic 6.7% |
| Navajo | 0.0 /100 | #342 | Tragic 6.7% |
| Tlingit-Haida | 0.0 /100 | #343 | Tragic 6.8% |
| Alaskan Athabascans | 0.0 /100 | #344 | Tragic 7.0% |
| Immigrants | Yemen | 0.0 /100 | #345 | Tragic 8.2% |
| Yup'ik | 0.0 /100 | #346 | Tragic 9.1% |
| Crow | 0.0 /100 | #347 | Tragic 16.9% |