Immigrants from Senegal vs Immigrants from Northern Europe Births to Unmarried Women
COMPARE
Immigrants from Senegal
Immigrants from Northern Europe
Births to Unmarried Women
Births to Unmarried Women Comparison
Immigrants from Senegal
Immigrants from Northern Europe
36.7%
BIRTHS TO UNMARRIED WOMEN
0.1/ 100
METRIC RATING
266th/ 347
METRIC RANK
28.6%
BIRTHS TO UNMARRIED WOMEN
98.3/ 100
METRIC RATING
77th/ 347
METRIC RANK
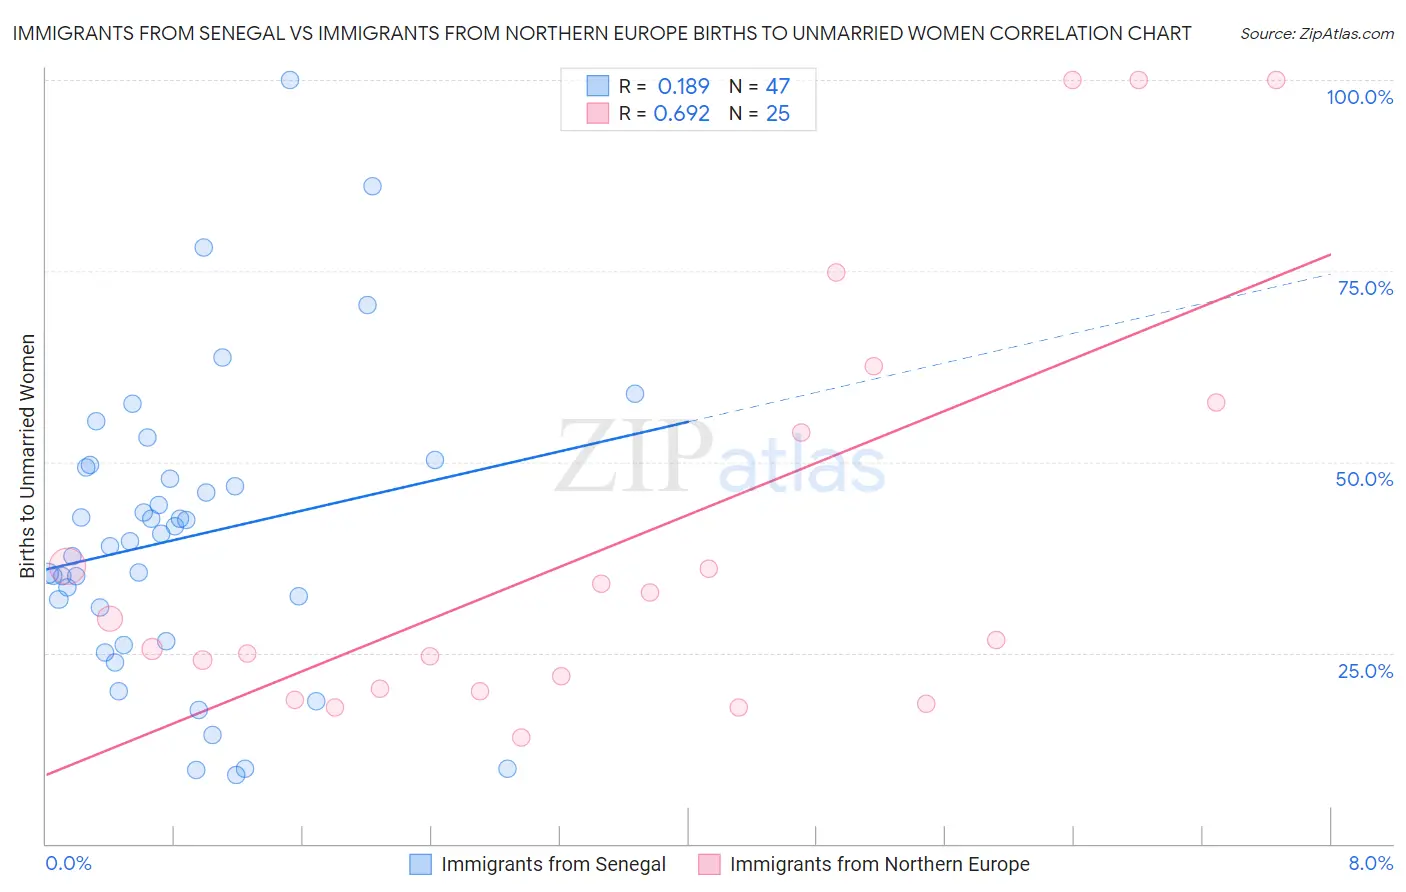
Immigrants from Senegal vs Immigrants from Northern Europe Births to Unmarried Women Correlation Chart
The statistical analysis conducted on geographies consisting of 88,702,422 people shows a poor positive correlation between the proportion of Immigrants from Senegal and percentage of births to unmarried women in the United States with a correlation coefficient (R) of 0.189 and weighted average of 36.7%. Similarly, the statistical analysis conducted on geographies consisting of 435,574,051 people shows a significant positive correlation between the proportion of Immigrants from Northern Europe and percentage of births to unmarried women in the United States with a correlation coefficient (R) of 0.692 and weighted average of 28.6%, a difference of 28.1%.
Births to Unmarried Women Correlation Summary
| Measurement | Immigrants from Senegal | Immigrants from Northern Europe |
| Minimum | 9.0% | 14.0% |
| Maximum | 100.0% | 100.0% |
| Range | 91.0% | 86.0% |
| Mean | 40.1% | 39.7% |
| Median | 39.5% | 26.6% |
| Interquartile 25% (IQ1) | 26.5% | 20.1% |
| Interquartile 75% (IQ3) | 49.2% | 55.9% |
| Interquartile Range (IQR) | 22.8% | 35.7% |
| Standard Deviation (Sample) | 19.3% | 27.4% |
| Standard Deviation (Population) | 19.1% | 26.9% |
Similar Demographics by Births to Unmarried Women
Demographics Similar to Immigrants from Senegal by Births to Unmarried Women
In terms of births to unmarried women, the demographic groups most similar to Immigrants from Senegal are Cherokee (36.7%, a difference of 0.050%), Central American (36.7%, a difference of 0.070%), Comanche (36.7%, a difference of 0.080%), Subsaharan African (36.7%, a difference of 0.10%), and Senegalese (36.8%, a difference of 0.20%).
| Demographics | Rating | Rank | Births to Unmarried Women |
| Immigrants | El Salvador | 0.2 /100 | #259 | Tragic 36.4% |
| Ottawa | 0.2 /100 | #260 | Tragic 36.5% |
| Trinidadians and Tobagonians | 0.2 /100 | #261 | Tragic 36.5% |
| French American Indians | 0.1 /100 | #262 | Tragic 36.6% |
| Nicaraguans | 0.1 /100 | #263 | Tragic 36.6% |
| Sub-Saharan Africans | 0.1 /100 | #264 | Tragic 36.7% |
| Cherokee | 0.1 /100 | #265 | Tragic 36.7% |
| Immigrants | Senegal | 0.1 /100 | #266 | Tragic 36.7% |
| Central Americans | 0.1 /100 | #267 | Tragic 36.7% |
| Comanche | 0.1 /100 | #268 | Tragic 36.7% |
| Senegalese | 0.1 /100 | #269 | Tragic 36.8% |
| Immigrants | Congo | 0.1 /100 | #270 | Tragic 36.8% |
| Immigrants | Barbados | 0.1 /100 | #271 | Tragic 36.8% |
| Choctaw | 0.1 /100 | #272 | Tragic 36.9% |
| Mexicans | 0.1 /100 | #273 | Tragic 36.9% |
Demographics Similar to Immigrants from Northern Europe by Births to Unmarried Women
In terms of births to unmarried women, the demographic groups most similar to Immigrants from Northern Europe are Zimbabwean (28.7%, a difference of 0.16%), Israeli (28.6%, a difference of 0.19%), Danish (28.7%, a difference of 0.19%), Immigrants from Switzerland (28.6%, a difference of 0.21%), and Immigrants from Afghanistan (28.7%, a difference of 0.21%).
| Demographics | Rating | Rank | Births to Unmarried Women |
| Laotians | 98.6 /100 | #70 | Exceptional 28.5% |
| Jordanians | 98.5 /100 | #71 | Exceptional 28.5% |
| Immigrants | Sweden | 98.5 /100 | #72 | Exceptional 28.5% |
| Albanians | 98.5 /100 | #73 | Exceptional 28.5% |
| Immigrants | Bolivia | 98.5 /100 | #74 | Exceptional 28.6% |
| Immigrants | Switzerland | 98.4 /100 | #75 | Exceptional 28.6% |
| Israelis | 98.4 /100 | #76 | Exceptional 28.6% |
| Immigrants | Northern Europe | 98.3 /100 | #77 | Exceptional 28.6% |
| Zimbabweans | 98.2 /100 | #78 | Exceptional 28.7% |
| Danes | 98.2 /100 | #79 | Exceptional 28.7% |
| Immigrants | Afghanistan | 98.1 /100 | #80 | Exceptional 28.7% |
| Immigrants | Austria | 98.1 /100 | #81 | Exceptional 28.7% |
| Romanians | 98.0 /100 | #82 | Exceptional 28.7% |
| Immigrants | Kuwait | 98.0 /100 | #83 | Exceptional 28.8% |
| Immigrants | Poland | 97.6 /100 | #84 | Exceptional 28.9% |