Immigrants from Saudi Arabia vs Salvadoran Male Poverty
COMPARE
Immigrants from Saudi Arabia
Salvadoran
Male Poverty
Male Poverty Comparison
Immigrants from Saudi Arabia
Salvadorans
12.7%
MALE POVERTY
0.4/ 100
METRIC RATING
236th/ 347
METRIC RANK
12.6%
MALE POVERTY
0.6/ 100
METRIC RATING
231st/ 347
METRIC RANK
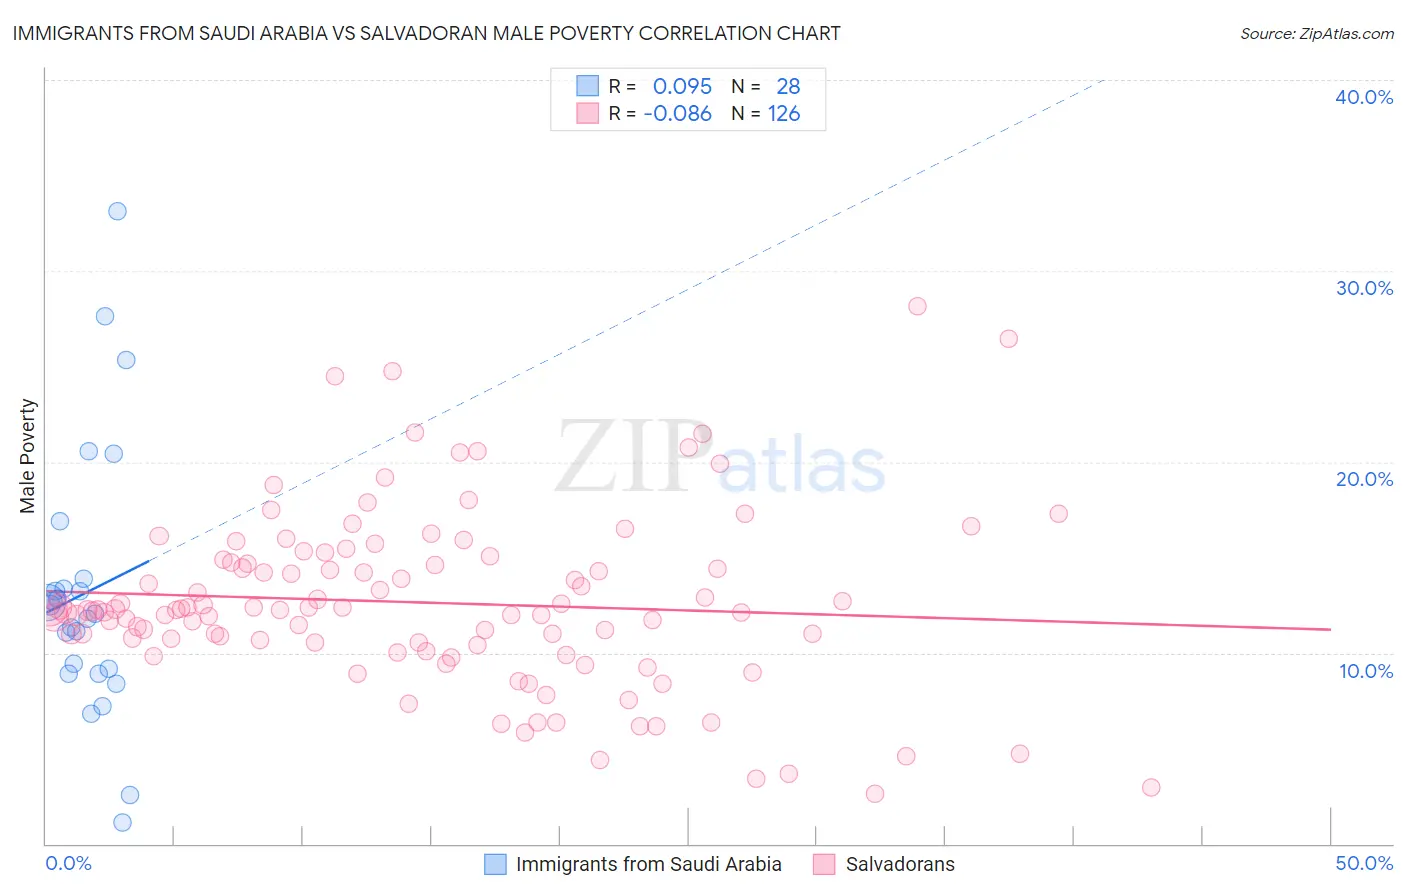
Immigrants from Saudi Arabia vs Salvadoran Male Poverty Correlation Chart
The statistical analysis conducted on geographies consisting of 164,207,457 people shows a slight positive correlation between the proportion of Immigrants from Saudi Arabia and poverty level among males in the United States with a correlation coefficient (R) of 0.095 and weighted average of 12.7%. Similarly, the statistical analysis conducted on geographies consisting of 398,602,565 people shows a slight negative correlation between the proportion of Salvadorans and poverty level among males in the United States with a correlation coefficient (R) of -0.086 and weighted average of 12.6%, a difference of 0.84%.
Male Poverty Correlation Summary
| Measurement | Immigrants from Saudi Arabia | Salvadoran |
| Minimum | 1.1% | 2.6% |
| Maximum | 33.1% | 28.2% |
| Range | 32.0% | 25.5% |
| Mean | 13.2% | 12.6% |
| Median | 12.3% | 12.2% |
| Interquartile 25% (IQ1) | 9.1% | 10.5% |
| Interquartile 75% (IQ3) | 13.6% | 14.7% |
| Interquartile Range (IQR) | 4.5% | 4.2% |
| Standard Deviation (Sample) | 7.0% | 4.6% |
| Standard Deviation (Population) | 6.9% | 4.6% |
Demographics Similar to Immigrants from Saudi Arabia and Salvadorans by Male Poverty
In terms of male poverty, the demographic groups most similar to Immigrants from Saudi Arabia are French American Indian (12.7%, a difference of 0.050%), Ecuadorian (12.7%, a difference of 0.080%), Ghanaian (12.7%, a difference of 0.080%), Immigrants from Laos (12.6%, a difference of 0.25%), and Immigrants from Middle Africa (12.7%, a difference of 0.35%). Similarly, the demographic groups most similar to Salvadorans are Nicaraguan (12.6%, a difference of 0.12%), Fijian (12.6%, a difference of 0.16%), Immigrants from Armenia (12.6%, a difference of 0.23%), Marshallese (12.5%, a difference of 0.56%), and Immigrants from Laos (12.6%, a difference of 0.59%).
| Demographics | Rating | Rank | Male Poverty |
| Immigrants | Micronesia | 2.1 /100 | #223 | Tragic 12.2% |
| Immigrants | Nigeria | 1.6 /100 | #224 | Tragic 12.3% |
| Osage | 1.5 /100 | #225 | Tragic 12.3% |
| Nigerians | 1.4 /100 | #226 | Tragic 12.3% |
| Alaska Natives | 1.4 /100 | #227 | Tragic 12.4% |
| Alsatians | 1.3 /100 | #228 | Tragic 12.4% |
| Cubans | 1.3 /100 | #229 | Tragic 12.4% |
| Marshallese | 0.8 /100 | #230 | Tragic 12.5% |
| Salvadorans | 0.6 /100 | #231 | Tragic 12.6% |
| Nicaraguans | 0.6 /100 | #232 | Tragic 12.6% |
| Fijians | 0.6 /100 | #233 | Tragic 12.6% |
| Immigrants | Armenia | 0.6 /100 | #234 | Tragic 12.6% |
| Immigrants | Laos | 0.5 /100 | #235 | Tragic 12.6% |
| Immigrants | Saudi Arabia | 0.4 /100 | #236 | Tragic 12.7% |
| French American Indians | 0.4 /100 | #237 | Tragic 12.7% |
| Ecuadorians | 0.4 /100 | #238 | Tragic 12.7% |
| Ghanaians | 0.4 /100 | #239 | Tragic 12.7% |
| Immigrants | Middle Africa | 0.4 /100 | #240 | Tragic 12.7% |
| Sudanese | 0.3 /100 | #241 | Tragic 12.8% |
| Nepalese | 0.3 /100 | #242 | Tragic 12.8% |
| Alaskan Athabascans | 0.3 /100 | #243 | Tragic 12.8% |