Immigrants from Saudi Arabia vs New Zealander 7th Grade
COMPARE
Immigrants from Saudi Arabia
New Zealander
7th Grade
7th Grade Comparison
Immigrants from Saudi Arabia
New Zealanders
96.6%
7TH GRADE
97.8/ 100
METRIC RATING
108th/ 347
METRIC RANK
96.8%
7TH GRADE
99.6/ 100
METRIC RATING
70th/ 347
METRIC RANK
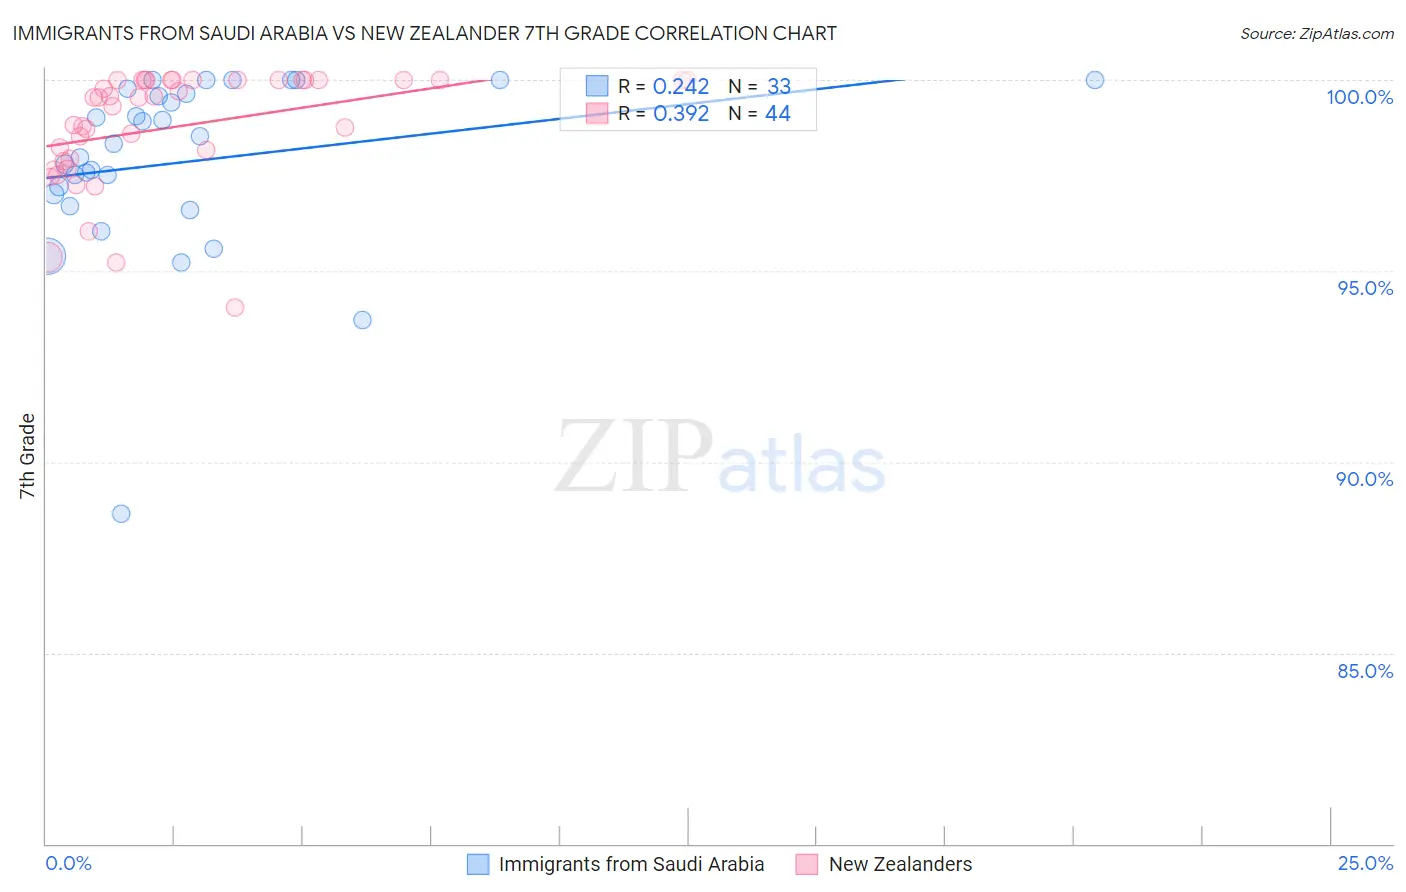
Immigrants from Saudi Arabia vs New Zealander 7th Grade Correlation Chart
The statistical analysis conducted on geographies consisting of 164,277,573 people shows a weak positive correlation between the proportion of Immigrants from Saudi Arabia and percentage of population with at least 7th grade education in the United States with a correlation coefficient (R) of 0.242 and weighted average of 96.6%. Similarly, the statistical analysis conducted on geographies consisting of 106,912,544 people shows a mild positive correlation between the proportion of New Zealanders and percentage of population with at least 7th grade education in the United States with a correlation coefficient (R) of 0.392 and weighted average of 96.8%, a difference of 0.26%.
7th Grade Correlation Summary
| Measurement | Immigrants from Saudi Arabia | New Zealander |
| Minimum | 88.6% | 94.0% |
| Maximum | 100.0% | 100.0% |
| Range | 11.4% | 6.0% |
| Mean | 97.9% | 98.8% |
| Median | 98.3% | 99.5% |
| Interquartile 25% (IQ1) | 96.9% | 97.9% |
| Interquartile 75% (IQ3) | 99.7% | 100.0% |
| Interquartile Range (IQR) | 2.9% | 2.1% |
| Standard Deviation (Sample) | 2.4% | 1.5% |
| Standard Deviation (Population) | 2.3% | 1.5% |
Similar Demographics by 7th Grade
Demographics Similar to Immigrants from Saudi Arabia by 7th Grade
In terms of 7th grade, the demographic groups most similar to Immigrants from Saudi Arabia are Lumbee (96.6%, a difference of 0.0%), Iroquois (96.6%, a difference of 0.010%), Bhutanese (96.6%, a difference of 0.010%), South African (96.6%, a difference of 0.020%), and Okinawan (96.6%, a difference of 0.020%).
| Demographics | Rating | Rank | 7th Grade |
| Thais | 98.6 /100 | #101 | Exceptional 96.7% |
| Immigrants | Czechoslovakia | 98.3 /100 | #102 | Exceptional 96.6% |
| Immigrants | Singapore | 98.3 /100 | #103 | Exceptional 96.6% |
| Shoshone | 98.1 /100 | #104 | Exceptional 96.6% |
| South Africans | 98.0 /100 | #105 | Exceptional 96.6% |
| Iroquois | 97.9 /100 | #106 | Exceptional 96.6% |
| Lumbee | 97.8 /100 | #107 | Exceptional 96.6% |
| Immigrants | Saudi Arabia | 97.8 /100 | #108 | Exceptional 96.6% |
| Bhutanese | 97.7 /100 | #109 | Exceptional 96.6% |
| Okinawans | 97.4 /100 | #110 | Exceptional 96.6% |
| Immigrants | Latvia | 97.4 /100 | #111 | Exceptional 96.6% |
| Immigrants | Nonimmigrants | 97.0 /100 | #112 | Exceptional 96.5% |
| Pueblo | 96.8 /100 | #113 | Exceptional 96.5% |
| Immigrants | Zimbabwe | 96.6 /100 | #114 | Exceptional 96.5% |
| Choctaw | 96.6 /100 | #115 | Exceptional 96.5% |
Demographics Similar to New Zealanders by 7th Grade
In terms of 7th grade, the demographic groups most similar to New Zealanders are Iranian (96.8%, a difference of 0.0%), Immigrants from Lithuania (96.8%, a difference of 0.010%), Cajun (96.8%, a difference of 0.010%), Immigrants from India (96.9%, a difference of 0.030%), and Arapaho (96.8%, a difference of 0.030%).
| Demographics | Rating | Rank | 7th Grade |
| Immigrants | Northern Europe | 99.7 /100 | #63 | Exceptional 96.9% |
| Immigrants | Austria | 99.7 /100 | #64 | Exceptional 96.9% |
| Canadians | 99.7 /100 | #65 | Exceptional 96.9% |
| Ukrainians | 99.7 /100 | #66 | Exceptional 96.9% |
| Native Hawaiians | 99.7 /100 | #67 | Exceptional 96.9% |
| Immigrants | India | 99.6 /100 | #68 | Exceptional 96.9% |
| Iranians | 99.6 /100 | #69 | Exceptional 96.8% |
| New Zealanders | 99.6 /100 | #70 | Exceptional 96.8% |
| Immigrants | Lithuania | 99.6 /100 | #71 | Exceptional 96.8% |
| Cajuns | 99.5 /100 | #72 | Exceptional 96.8% |
| Arapaho | 99.5 /100 | #73 | Exceptional 96.8% |
| Immigrants | England | 99.5 /100 | #74 | Exceptional 96.8% |
| Zimbabweans | 99.5 /100 | #75 | Exceptional 96.8% |
| Immigrants | Ireland | 99.4 /100 | #76 | Exceptional 96.8% |
| Cherokee | 99.4 /100 | #77 | Exceptional 96.8% |