Immigrants from Northern Europe vs Nepalese Male Disability
COMPARE
Immigrants from Northern Europe
Nepalese
Male Disability
Male Disability Comparison
Immigrants from Northern Europe
Nepalese
11.1%
MALE DISABILITY
73.2/ 100
METRIC RATING
153rd/ 347
METRIC RANK
12.2%
MALE DISABILITY
0.2/ 100
METRIC RATING
264th/ 347
METRIC RANK
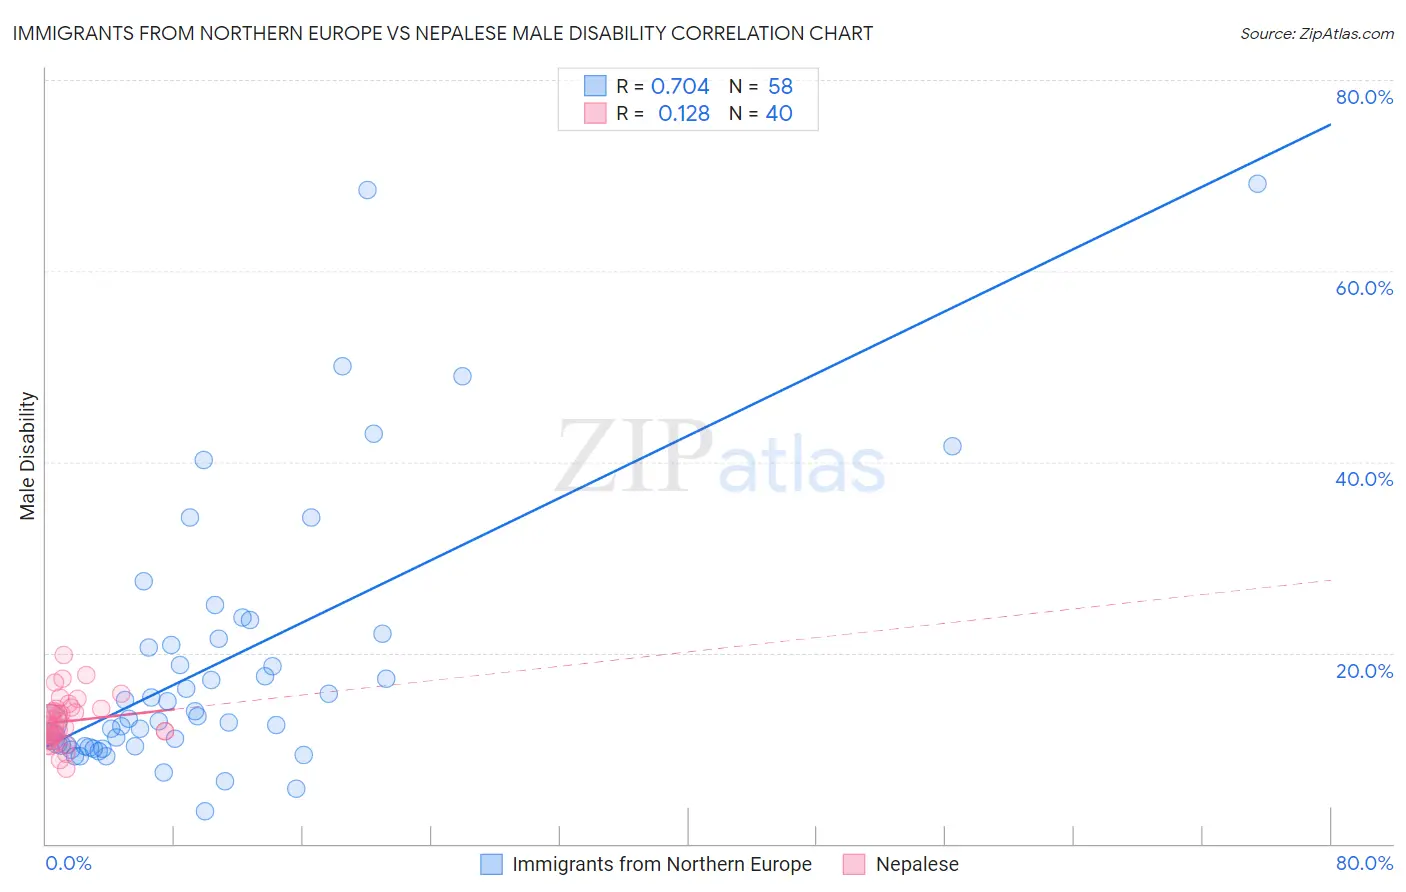
Immigrants from Northern Europe vs Nepalese Male Disability Correlation Chart
The statistical analysis conducted on geographies consisting of 477,177,667 people shows a strong positive correlation between the proportion of Immigrants from Northern Europe and percentage of males with a disability in the United States with a correlation coefficient (R) of 0.704 and weighted average of 11.1%. Similarly, the statistical analysis conducted on geographies consisting of 24,521,755 people shows a poor positive correlation between the proportion of Nepalese and percentage of males with a disability in the United States with a correlation coefficient (R) of 0.128 and weighted average of 12.2%, a difference of 10.3%.
Male Disability Correlation Summary
| Measurement | Immigrants from Northern Europe | Nepalese |
| Minimum | 3.4% | 7.8% |
| Maximum | 69.2% | 19.7% |
| Range | 65.8% | 11.9% |
| Mean | 19.0% | 12.8% |
| Median | 13.3% | 12.4% |
| Interquartile 25% (IQ1) | 10.2% | 11.1% |
| Interquartile 75% (IQ3) | 21.4% | 14.2% |
| Interquartile Range (IQR) | 11.2% | 3.1% |
| Standard Deviation (Sample) | 14.2% | 2.5% |
| Standard Deviation (Population) | 14.1% | 2.5% |
Similar Demographics by Male Disability
Demographics Similar to Immigrants from Northern Europe by Male Disability
In terms of male disability, the demographic groups most similar to Immigrants from Northern Europe are Immigrants from Moldova (11.1%, a difference of 0.020%), Immigrants from Albania (11.0%, a difference of 0.090%), Cuban (11.0%, a difference of 0.12%), Immigrants from Guatemala (11.0%, a difference of 0.14%), and Immigrants from Middle Africa (11.1%, a difference of 0.16%).
| Demographics | Rating | Rank | Male Disability |
| Koreans | 77.5 /100 | #146 | Good 11.0% |
| Immigrants | Croatia | 77.3 /100 | #147 | Good 11.0% |
| Sudanese | 77.1 /100 | #148 | Good 11.0% |
| Immigrants | Denmark | 76.4 /100 | #149 | Good 11.0% |
| Immigrants | Guatemala | 75.1 /100 | #150 | Good 11.0% |
| Cubans | 74.9 /100 | #151 | Good 11.0% |
| Immigrants | Albania | 74.4 /100 | #152 | Good 11.0% |
| Immigrants | Northern Europe | 73.2 /100 | #153 | Good 11.1% |
| Immigrants | Moldova | 72.8 /100 | #154 | Good 11.1% |
| Immigrants | Middle Africa | 70.9 /100 | #155 | Good 11.1% |
| Russians | 69.8 /100 | #156 | Good 11.1% |
| Immigrants | Western Africa | 69.2 /100 | #157 | Good 11.1% |
| Latvians | 68.1 /100 | #158 | Good 11.1% |
| Guatemalans | 67.2 /100 | #159 | Good 11.1% |
| Albanians | 66.5 /100 | #160 | Good 11.1% |
Demographics Similar to Nepalese by Male Disability
In terms of male disability, the demographic groups most similar to Nepalese are Canadian (12.2%, a difference of 0.030%), Norwegian (12.2%, a difference of 0.23%), Slavic (12.2%, a difference of 0.25%), Immigrants from Portugal (12.3%, a difference of 0.46%), and Hawaiian (12.3%, a difference of 0.47%).
| Demographics | Rating | Rank | Male Disability |
| Europeans | 0.3 /100 | #257 | Tragic 12.1% |
| Basques | 0.3 /100 | #258 | Tragic 12.1% |
| Belgians | 0.3 /100 | #259 | Tragic 12.1% |
| Swedes | 0.3 /100 | #260 | Tragic 12.1% |
| Slavs | 0.2 /100 | #261 | Tragic 12.2% |
| Norwegians | 0.2 /100 | #262 | Tragic 12.2% |
| Canadians | 0.2 /100 | #263 | Tragic 12.2% |
| Nepalese | 0.2 /100 | #264 | Tragic 12.2% |
| Immigrants | Portugal | 0.1 /100 | #265 | Tragic 12.3% |
| Hawaiians | 0.1 /100 | #266 | Tragic 12.3% |
| Immigrants | Germany | 0.1 /100 | #267 | Tragic 12.3% |
| Portuguese | 0.1 /100 | #268 | Tragic 12.3% |
| Czechoslovakians | 0.1 /100 | #269 | Tragic 12.3% |
| Spaniards | 0.1 /100 | #270 | Tragic 12.3% |
| Scandinavians | 0.1 /100 | #271 | Tragic 12.3% |