Yugoslavian vs Nepalese Poverty
COMPARE
Yugoslavian
Nepalese
Poverty
Poverty Comparison
Yugoslavians
Nepalese
11.8%
POVERTY
85.2/ 100
METRIC RATING
134th/ 347
METRIC RANK
14.0%
POVERTY
0.3/ 100
METRIC RATING
244th/ 347
METRIC RANK
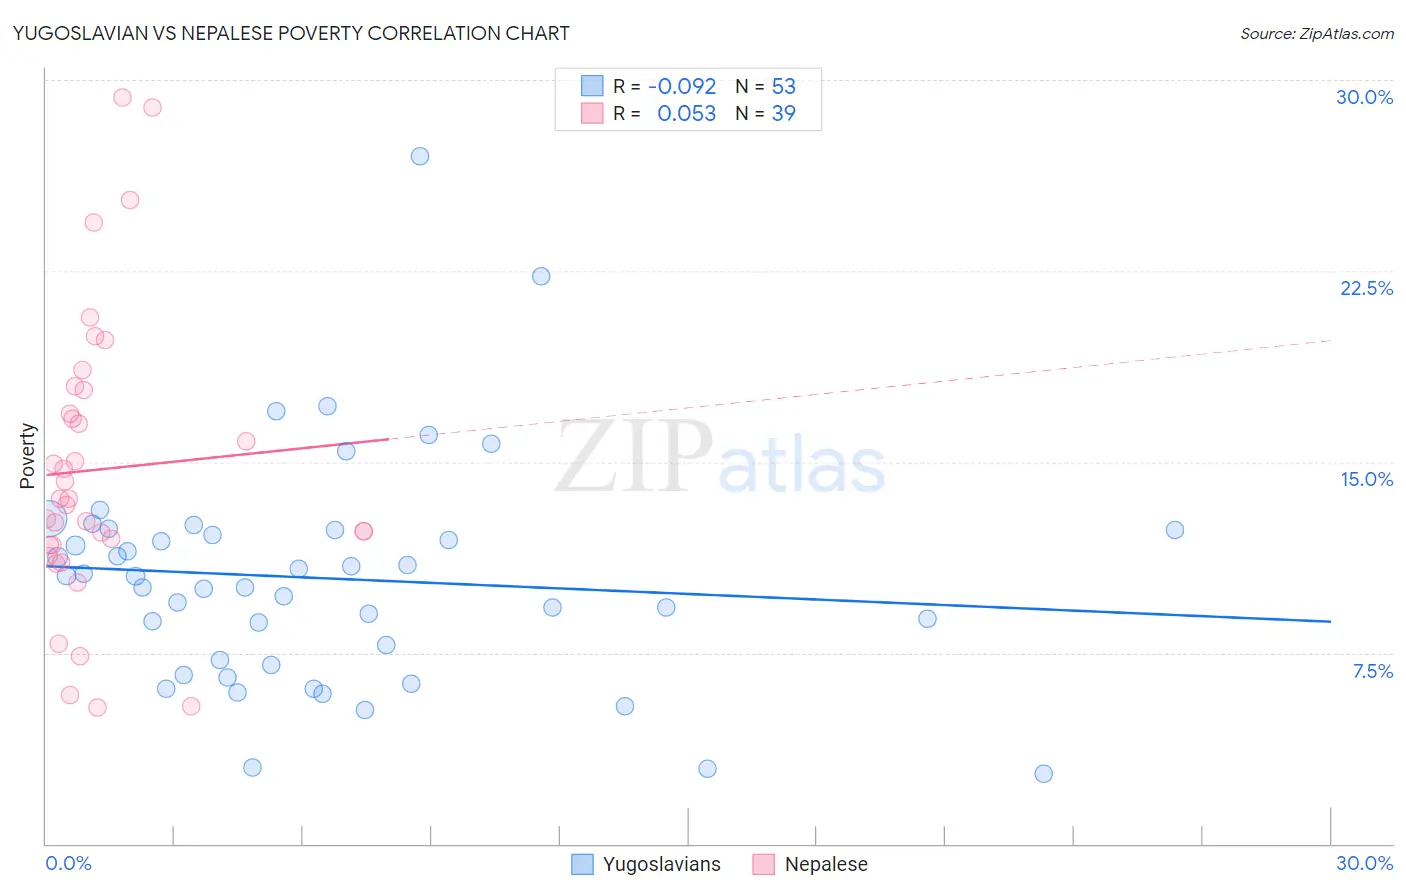
Yugoslavian vs Nepalese Poverty Correlation Chart
The statistical analysis conducted on geographies consisting of 285,571,582 people shows a slight negative correlation between the proportion of Yugoslavians and poverty level in the United States with a correlation coefficient (R) of -0.092 and weighted average of 11.8%. Similarly, the statistical analysis conducted on geographies consisting of 24,519,269 people shows a slight positive correlation between the proportion of Nepalese and poverty level in the United States with a correlation coefficient (R) of 0.053 and weighted average of 14.0%, a difference of 18.8%.
Poverty Correlation Summary
| Measurement | Yugoslavian | Nepalese |
| Minimum | 2.7% | 5.4% |
| Maximum | 27.0% | 29.3% |
| Range | 24.3% | 23.9% |
| Mean | 10.4% | 14.7% |
| Median | 10.5% | 13.6% |
| Interquartile 25% (IQ1) | 7.1% | 11.7% |
| Interquartile 75% (IQ3) | 12.3% | 17.8% |
| Interquartile Range (IQR) | 5.2% | 6.1% |
| Standard Deviation (Sample) | 4.4% | 5.7% |
| Standard Deviation (Population) | 4.4% | 5.6% |
Similar Demographics by Poverty
Demographics Similar to Yugoslavians by Poverty
In terms of poverty, the demographic groups most similar to Yugoslavians are Immigrants from Western Europe (11.8%, a difference of 0.010%), Immigrants from Vietnam (11.8%, a difference of 0.010%), Peruvian (11.8%, a difference of 0.080%), French (11.8%, a difference of 0.19%), and Chilean (11.8%, a difference of 0.20%).
| Demographics | Rating | Rank | Poverty |
| Immigrants | Argentina | 88.0 /100 | #127 | Excellent 11.7% |
| Immigrants | Israel | 87.4 /100 | #128 | Excellent 11.7% |
| South Africans | 87.0 /100 | #129 | Excellent 11.7% |
| Immigrants | Ukraine | 86.6 /100 | #130 | Excellent 11.8% |
| French | 86.1 /100 | #131 | Excellent 11.8% |
| Peruvians | 85.6 /100 | #132 | Excellent 11.8% |
| Immigrants | Western Europe | 85.2 /100 | #133 | Excellent 11.8% |
| Yugoslavians | 85.2 /100 | #134 | Excellent 11.8% |
| Immigrants | Vietnam | 85.2 /100 | #135 | Excellent 11.8% |
| Chileans | 84.2 /100 | #136 | Excellent 11.8% |
| Immigrants | Switzerland | 83.0 /100 | #137 | Excellent 11.8% |
| Immigrants | Jordan | 82.4 /100 | #138 | Excellent 11.9% |
| Pakistanis | 82.2 /100 | #139 | Excellent 11.9% |
| Immigrants | Peru | 81.1 /100 | #140 | Excellent 11.9% |
| Immigrants | France | 80.5 /100 | #141 | Excellent 11.9% |
Demographics Similar to Nepalese by Poverty
In terms of poverty, the demographic groups most similar to Nepalese are Sudanese (14.0%, a difference of 0.030%), Ecuadorian (14.0%, a difference of 0.10%), Immigrants from Sudan (14.1%, a difference of 0.39%), Salvadoran (14.0%, a difference of 0.41%), and Immigrants from Middle Africa (14.0%, a difference of 0.44%).
| Demographics | Rating | Rank | Poverty |
| French American Indians | 0.5 /100 | #237 | Tragic 13.9% |
| Ghanaians | 0.5 /100 | #238 | Tragic 13.9% |
| Nicaraguans | 0.4 /100 | #239 | Tragic 13.9% |
| Immigrants | Middle Africa | 0.4 /100 | #240 | Tragic 14.0% |
| Salvadorans | 0.4 /100 | #241 | Tragic 14.0% |
| Ecuadorians | 0.4 /100 | #242 | Tragic 14.0% |
| Sudanese | 0.3 /100 | #243 | Tragic 14.0% |
| Nepalese | 0.3 /100 | #244 | Tragic 14.0% |
| Immigrants | Sudan | 0.3 /100 | #245 | Tragic 14.1% |
| Potawatomi | 0.3 /100 | #246 | Tragic 14.1% |
| Liberians | 0.2 /100 | #247 | Tragic 14.1% |
| Immigrants | Western Africa | 0.2 /100 | #248 | Tragic 14.1% |
| Immigrants | Ghana | 0.2 /100 | #249 | Tragic 14.2% |
| Cree | 0.2 /100 | #250 | Tragic 14.2% |
| Immigrants | Burma/Myanmar | 0.2 /100 | #251 | Tragic 14.2% |