Hawaiian vs Nepalese Poverty
COMPARE
Hawaiian
Nepalese
Poverty
Poverty Comparison
Hawaiians
Nepalese
12.5%
POVERTY
34.1/ 100
METRIC RATING
187th/ 347
METRIC RANK
14.0%
POVERTY
0.3/ 100
METRIC RATING
244th/ 347
METRIC RANK
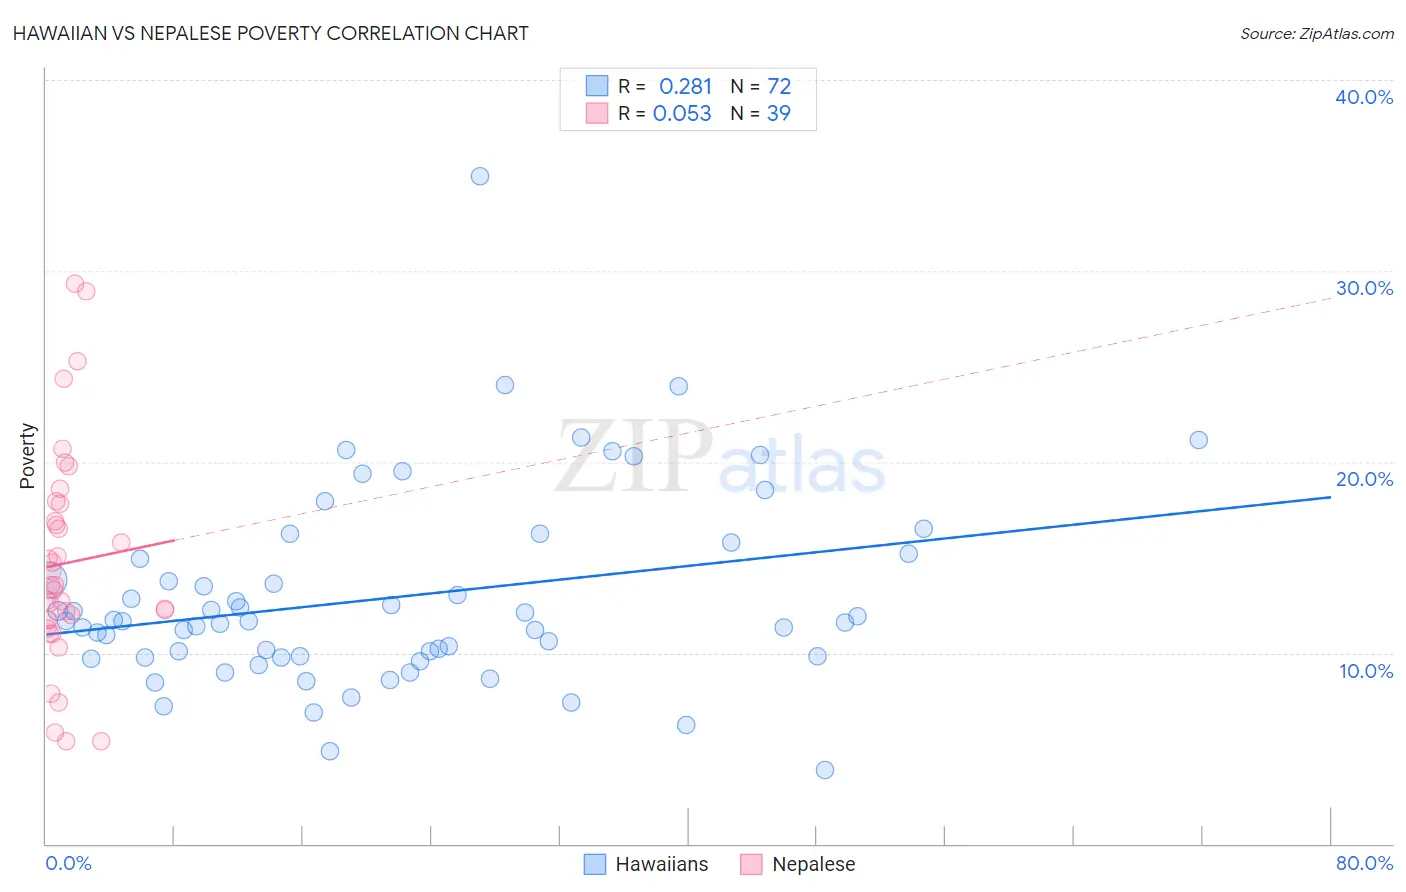
Hawaiian vs Nepalese Poverty Correlation Chart
The statistical analysis conducted on geographies consisting of 327,385,556 people shows a weak positive correlation between the proportion of Hawaiians and poverty level in the United States with a correlation coefficient (R) of 0.281 and weighted average of 12.5%. Similarly, the statistical analysis conducted on geographies consisting of 24,519,269 people shows a slight positive correlation between the proportion of Nepalese and poverty level in the United States with a correlation coefficient (R) of 0.053 and weighted average of 14.0%, a difference of 12.0%.
Poverty Correlation Summary
| Measurement | Hawaiian | Nepalese |
| Minimum | 3.8% | 5.4% |
| Maximum | 35.0% | 29.3% |
| Range | 31.1% | 23.9% |
| Mean | 12.9% | 14.7% |
| Median | 11.6% | 13.6% |
| Interquartile 25% (IQ1) | 9.8% | 11.7% |
| Interquartile 75% (IQ3) | 15.1% | 17.8% |
| Interquartile Range (IQR) | 5.3% | 6.1% |
| Standard Deviation (Sample) | 5.1% | 5.7% |
| Standard Deviation (Population) | 5.1% | 5.6% |
Similar Demographics by Poverty
Demographics Similar to Hawaiians by Poverty
In terms of poverty, the demographic groups most similar to Hawaiians are Immigrants from Costa Rica (12.5%, a difference of 0.090%), Aleut (12.5%, a difference of 0.090%), Immigrants from South America (12.5%, a difference of 0.19%), Immigrants from Sierra Leone (12.5%, a difference of 0.23%), and Israeli (12.5%, a difference of 0.25%).
| Demographics | Rating | Rank | Poverty |
| Mongolians | 43.6 /100 | #180 | Average 12.4% |
| Immigrants | Afghanistan | 42.1 /100 | #181 | Average 12.4% |
| Immigrants | Cameroon | 41.7 /100 | #182 | Average 12.4% |
| Immigrants | Iraq | 40.2 /100 | #183 | Average 12.4% |
| Kenyans | 38.8 /100 | #184 | Fair 12.5% |
| Israelis | 36.4 /100 | #185 | Fair 12.5% |
| Immigrants | Sierra Leone | 36.3 /100 | #186 | Fair 12.5% |
| Hawaiians | 34.1 /100 | #187 | Fair 12.5% |
| Immigrants | Costa Rica | 33.3 /100 | #188 | Fair 12.5% |
| Aleuts | 33.2 /100 | #189 | Fair 12.5% |
| Immigrants | South America | 32.3 /100 | #190 | Fair 12.5% |
| Sierra Leoneans | 31.5 /100 | #191 | Fair 12.6% |
| South American Indians | 23.3 /100 | #192 | Fair 12.7% |
| Delaware | 21.4 /100 | #193 | Fair 12.7% |
| Arabs | 21.1 /100 | #194 | Fair 12.7% |
Demographics Similar to Nepalese by Poverty
In terms of poverty, the demographic groups most similar to Nepalese are Sudanese (14.0%, a difference of 0.030%), Ecuadorian (14.0%, a difference of 0.10%), Immigrants from Sudan (14.1%, a difference of 0.39%), Salvadoran (14.0%, a difference of 0.41%), and Immigrants from Middle Africa (14.0%, a difference of 0.44%).
| Demographics | Rating | Rank | Poverty |
| French American Indians | 0.5 /100 | #237 | Tragic 13.9% |
| Ghanaians | 0.5 /100 | #238 | Tragic 13.9% |
| Nicaraguans | 0.4 /100 | #239 | Tragic 13.9% |
| Immigrants | Middle Africa | 0.4 /100 | #240 | Tragic 14.0% |
| Salvadorans | 0.4 /100 | #241 | Tragic 14.0% |
| Ecuadorians | 0.4 /100 | #242 | Tragic 14.0% |
| Sudanese | 0.3 /100 | #243 | Tragic 14.0% |
| Nepalese | 0.3 /100 | #244 | Tragic 14.0% |
| Immigrants | Sudan | 0.3 /100 | #245 | Tragic 14.1% |
| Potawatomi | 0.3 /100 | #246 | Tragic 14.1% |
| Liberians | 0.2 /100 | #247 | Tragic 14.1% |
| Immigrants | Western Africa | 0.2 /100 | #248 | Tragic 14.1% |
| Immigrants | Ghana | 0.2 /100 | #249 | Tragic 14.2% |
| Cree | 0.2 /100 | #250 | Tragic 14.2% |
| Immigrants | Burma/Myanmar | 0.2 /100 | #251 | Tragic 14.2% |