Immigrants from Micronesia vs Nepalese Poverty
COMPARE
Immigrants from Micronesia
Nepalese
Poverty
Poverty Comparison
Immigrants from Micronesia
Nepalese
13.4%
POVERTY
2.6/ 100
METRIC RATING
222nd/ 347
METRIC RANK
14.0%
POVERTY
0.3/ 100
METRIC RATING
244th/ 347
METRIC RANK
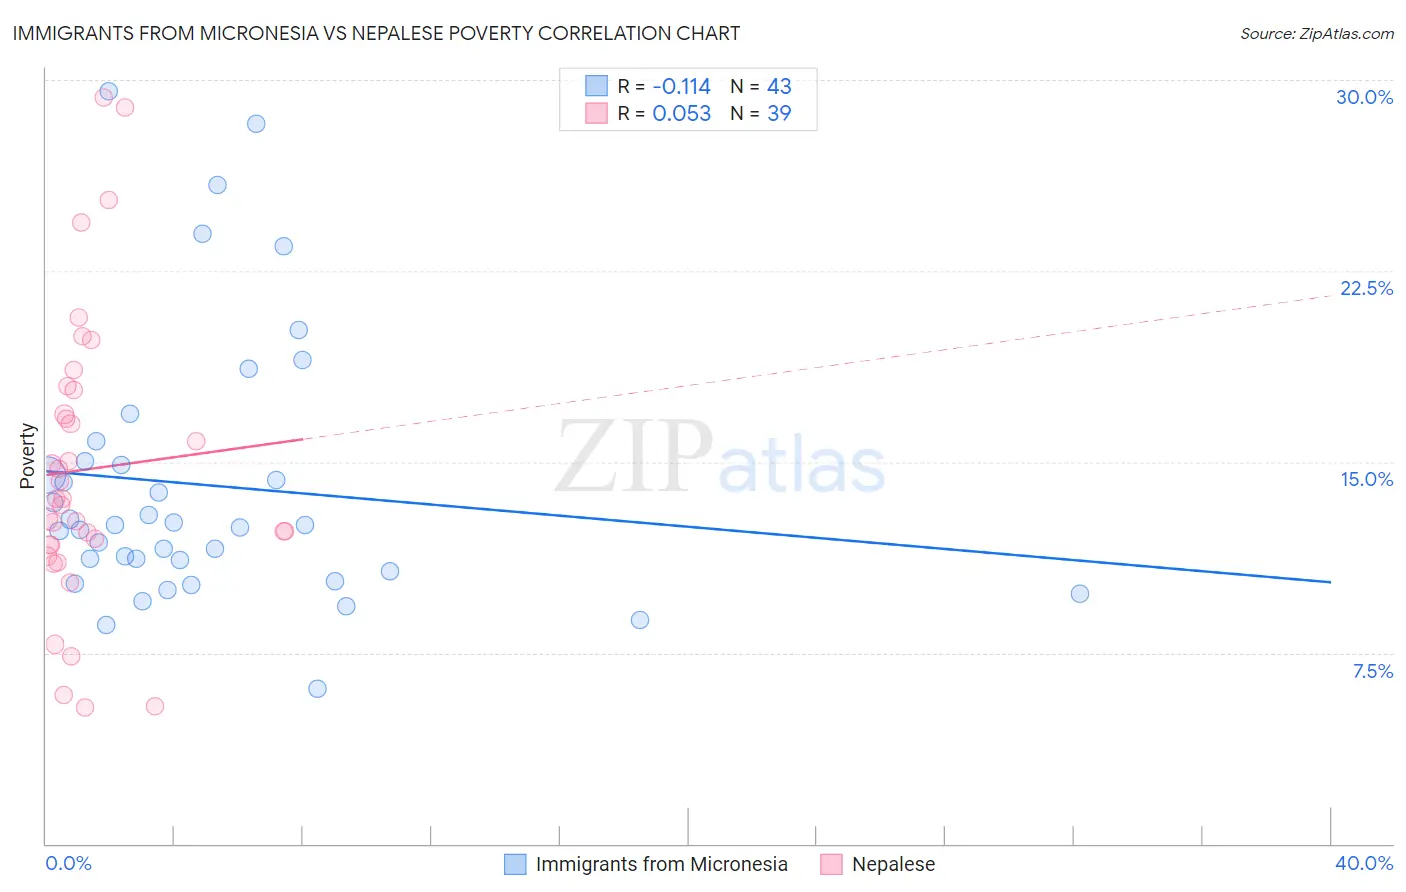
Immigrants from Micronesia vs Nepalese Poverty Correlation Chart
The statistical analysis conducted on geographies consisting of 61,600,869 people shows a poor negative correlation between the proportion of Immigrants from Micronesia and poverty level in the United States with a correlation coefficient (R) of -0.114 and weighted average of 13.4%. Similarly, the statistical analysis conducted on geographies consisting of 24,519,269 people shows a slight positive correlation between the proportion of Nepalese and poverty level in the United States with a correlation coefficient (R) of 0.053 and weighted average of 14.0%, a difference of 4.6%.
Poverty Correlation Summary
| Measurement | Immigrants from Micronesia | Nepalese |
| Minimum | 6.1% | 5.4% |
| Maximum | 29.6% | 29.3% |
| Range | 23.5% | 23.9% |
| Mean | 14.1% | 14.7% |
| Median | 12.5% | 13.6% |
| Interquartile 25% (IQ1) | 10.7% | 11.7% |
| Interquartile 75% (IQ3) | 15.0% | 17.8% |
| Interquartile Range (IQR) | 4.4% | 6.1% |
| Standard Deviation (Sample) | 5.3% | 5.7% |
| Standard Deviation (Population) | 5.3% | 5.6% |
Similar Demographics by Poverty
Demographics Similar to Immigrants from Micronesia by Poverty
In terms of poverty, the demographic groups most similar to Immigrants from Micronesia are Alsatian (13.4%, a difference of 0.040%), Immigrants from Africa (13.4%, a difference of 0.040%), Immigrants from Eritrea (13.4%, a difference of 0.14%), American (13.4%, a difference of 0.24%), and Immigrants from Cambodia (13.4%, a difference of 0.33%).
| Demographics | Rating | Rank | Poverty |
| Japanese | 3.3 /100 | #215 | Tragic 13.3% |
| Immigrants | Nonimmigrants | 3.3 /100 | #216 | Tragic 13.3% |
| Immigrants | Uzbekistan | 3.2 /100 | #217 | Tragic 13.3% |
| Immigrants | Thailand | 3.1 /100 | #218 | Tragic 13.3% |
| Immigrants | Cambodia | 3.0 /100 | #219 | Tragic 13.4% |
| Americans | 2.9 /100 | #220 | Tragic 13.4% |
| Alsatians | 2.6 /100 | #221 | Tragic 13.4% |
| Immigrants | Micronesia | 2.6 /100 | #222 | Tragic 13.4% |
| Immigrants | Africa | 2.5 /100 | #223 | Tragic 13.4% |
| Immigrants | Eritrea | 2.4 /100 | #224 | Tragic 13.4% |
| German Russians | 2.2 /100 | #225 | Tragic 13.4% |
| Marshallese | 2.2 /100 | #226 | Tragic 13.4% |
| Alaska Natives | 2.1 /100 | #227 | Tragic 13.5% |
| Immigrants | Nigeria | 1.7 /100 | #228 | Tragic 13.5% |
| Osage | 1.5 /100 | #229 | Tragic 13.6% |
Demographics Similar to Nepalese by Poverty
In terms of poverty, the demographic groups most similar to Nepalese are Sudanese (14.0%, a difference of 0.030%), Ecuadorian (14.0%, a difference of 0.10%), Immigrants from Sudan (14.1%, a difference of 0.39%), Salvadoran (14.0%, a difference of 0.41%), and Immigrants from Middle Africa (14.0%, a difference of 0.44%).
| Demographics | Rating | Rank | Poverty |
| French American Indians | 0.5 /100 | #237 | Tragic 13.9% |
| Ghanaians | 0.5 /100 | #238 | Tragic 13.9% |
| Nicaraguans | 0.4 /100 | #239 | Tragic 13.9% |
| Immigrants | Middle Africa | 0.4 /100 | #240 | Tragic 14.0% |
| Salvadorans | 0.4 /100 | #241 | Tragic 14.0% |
| Ecuadorians | 0.4 /100 | #242 | Tragic 14.0% |
| Sudanese | 0.3 /100 | #243 | Tragic 14.0% |
| Nepalese | 0.3 /100 | #244 | Tragic 14.0% |
| Immigrants | Sudan | 0.3 /100 | #245 | Tragic 14.1% |
| Potawatomi | 0.3 /100 | #246 | Tragic 14.1% |
| Liberians | 0.2 /100 | #247 | Tragic 14.1% |
| Immigrants | Western Africa | 0.2 /100 | #248 | Tragic 14.1% |
| Immigrants | Ghana | 0.2 /100 | #249 | Tragic 14.2% |
| Cree | 0.2 /100 | #250 | Tragic 14.2% |
| Immigrants | Burma/Myanmar | 0.2 /100 | #251 | Tragic 14.2% |