Immigrants from Nicaragua vs Houma Female Poverty
COMPARE
Immigrants from Nicaragua
Houma
Female Poverty
Female Poverty Comparison
Immigrants from Nicaragua
Houma
15.8%
FEMALE POVERTY
0.1/ 100
METRIC RATING
268th/ 347
METRIC RANK
20.0%
FEMALE POVERTY
0.0/ 100
METRIC RATING
334th/ 347
METRIC RANK
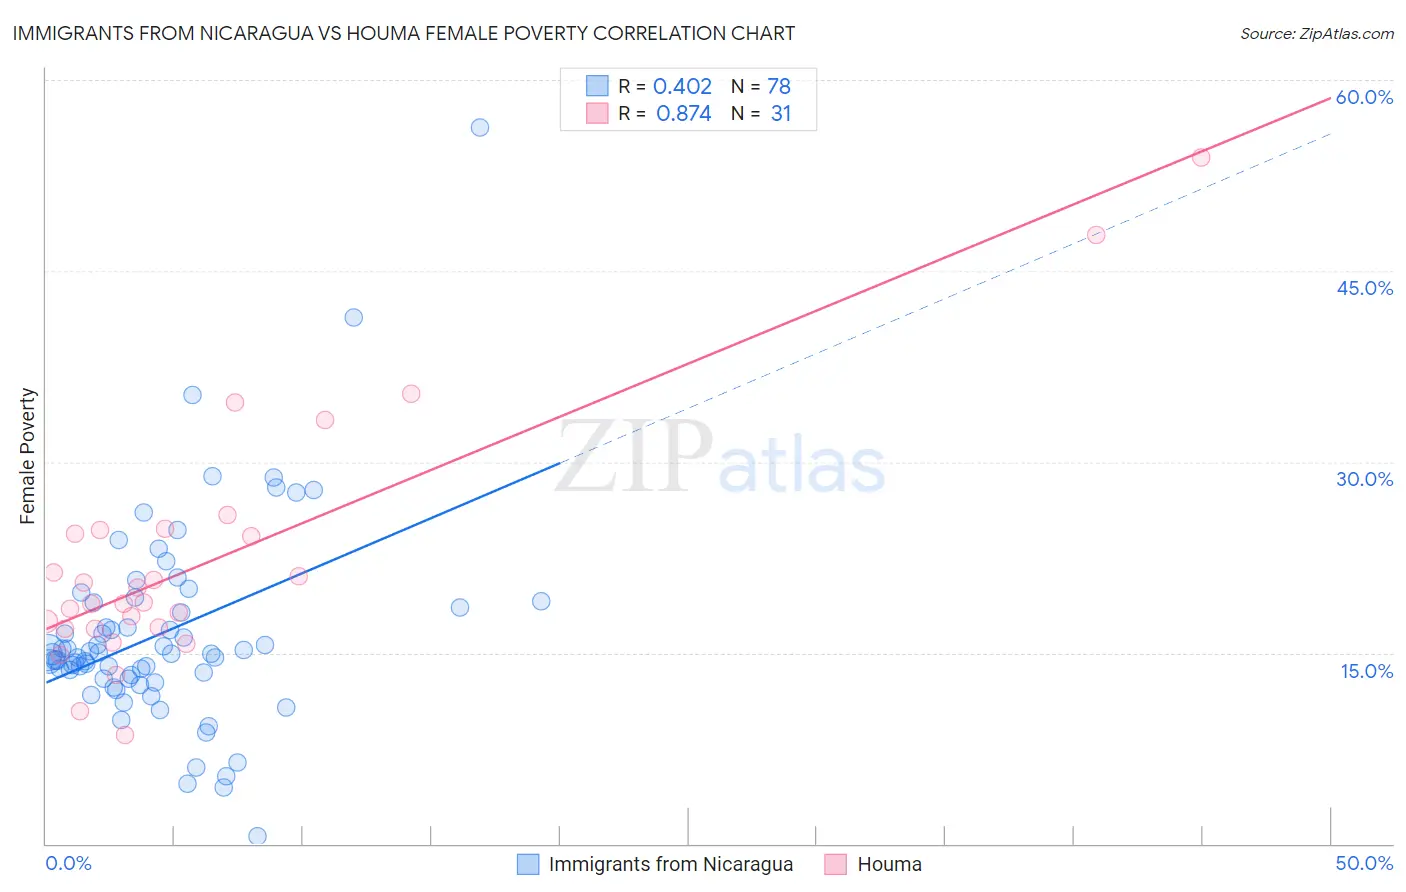
Immigrants from Nicaragua vs Houma Female Poverty Correlation Chart
The statistical analysis conducted on geographies consisting of 236,310,787 people shows a moderate positive correlation between the proportion of Immigrants from Nicaragua and poverty level among females in the United States with a correlation coefficient (R) of 0.402 and weighted average of 15.8%. Similarly, the statistical analysis conducted on geographies consisting of 36,796,778 people shows a very strong positive correlation between the proportion of Houma and poverty level among females in the United States with a correlation coefficient (R) of 0.874 and weighted average of 20.0%, a difference of 27.1%.
Female Poverty Correlation Summary
| Measurement | Immigrants from Nicaragua | Houma |
| Minimum | 0.58% | 8.5% |
| Maximum | 56.3% | 53.9% |
| Range | 55.7% | 45.4% |
| Mean | 16.6% | 22.3% |
| Median | 14.9% | 19.0% |
| Interquartile 25% (IQ1) | 13.0% | 16.9% |
| Interquartile 75% (IQ3) | 19.0% | 24.6% |
| Interquartile Range (IQR) | 6.0% | 7.7% |
| Standard Deviation (Sample) | 8.1% | 9.8% |
| Standard Deviation (Population) | 8.0% | 9.7% |
Similar Demographics by Female Poverty
Demographics Similar to Immigrants from Nicaragua by Female Poverty
In terms of female poverty, the demographic groups most similar to Immigrants from Nicaragua are Subsaharan African (15.8%, a difference of 0.060%), Iroquois (15.8%, a difference of 0.37%), Immigrants from El Salvador (15.7%, a difference of 0.49%), Immigrants from Liberia (15.7%, a difference of 0.55%), and Chickasaw (15.9%, a difference of 0.63%).
| Demographics | Rating | Rank | Female Poverty |
| Guyanese | 0.1 /100 | #261 | Tragic 15.6% |
| Mexican American Indians | 0.1 /100 | #262 | Tragic 15.6% |
| Cherokee | 0.1 /100 | #263 | Tragic 15.6% |
| Immigrants | Ecuador | 0.1 /100 | #264 | Tragic 15.6% |
| Immigrants | Liberia | 0.1 /100 | #265 | Tragic 15.7% |
| Immigrants | El Salvador | 0.1 /100 | #266 | Tragic 15.7% |
| Sub-Saharan Africans | 0.1 /100 | #267 | Tragic 15.8% |
| Immigrants | Nicaragua | 0.1 /100 | #268 | Tragic 15.8% |
| Iroquois | 0.1 /100 | #269 | Tragic 15.8% |
| Chickasaw | 0.1 /100 | #270 | Tragic 15.9% |
| Immigrants | St. Vincent and the Grenadines | 0.0 /100 | #271 | Tragic 15.9% |
| Belizeans | 0.0 /100 | #272 | Tragic 15.9% |
| Haitians | 0.0 /100 | #273 | Tragic 15.9% |
| Barbadians | 0.0 /100 | #274 | Tragic 15.9% |
| Immigrants | Barbados | 0.0 /100 | #275 | Tragic 16.0% |
Demographics Similar to Houma by Female Poverty
In terms of female poverty, the demographic groups most similar to Houma are Cheyenne (20.2%, a difference of 0.77%), Pueblo (20.7%, a difference of 3.2%), Immigrants from Dominican Republic (19.3%, a difference of 3.6%), Yuman (20.8%, a difference of 4.0%), and Apache (19.2%, a difference of 4.2%).
| Demographics | Rating | Rank | Female Poverty |
| Yakama | 0.0 /100 | #327 | Tragic 18.0% |
| Blacks/African Americans | 0.0 /100 | #328 | Tragic 18.6% |
| Kiowa | 0.0 /100 | #329 | Tragic 18.6% |
| Dominicans | 0.0 /100 | #330 | Tragic 19.1% |
| Natives/Alaskans | 0.0 /100 | #331 | Tragic 19.2% |
| Apache | 0.0 /100 | #332 | Tragic 19.2% |
| Immigrants | Dominican Republic | 0.0 /100 | #333 | Tragic 19.3% |
| Houma | 0.0 /100 | #334 | Tragic 20.0% |
| Cheyenne | 0.0 /100 | #335 | Tragic 20.2% |
| Pueblo | 0.0 /100 | #336 | Tragic 20.7% |
| Yuman | 0.0 /100 | #337 | Tragic 20.8% |
| Sioux | 0.0 /100 | #338 | Tragic 20.9% |
| Hopi | 0.0 /100 | #339 | Tragic 21.0% |
| Yup'ik | 0.0 /100 | #340 | Tragic 21.5% |
| Crow | 0.0 /100 | #341 | Tragic 22.1% |