Immigrants from Moldova vs Carpatho Rusyn Married-Couple Family Poverty
COMPARE
Immigrants from Moldova
Carpatho Rusyn
Married-Couple Family Poverty
Married-Couple Family Poverty Comparison
Immigrants from Moldova
Carpatho Rusyns
4.7%
MARRIED-COUPLE FAMILY POVERTY
97.1/ 100
METRIC RATING
104th/ 347
METRIC RANK
3.9%
MARRIED-COUPLE FAMILY POVERTY
100.0/ 100
METRIC RATING
10th/ 347
METRIC RANK
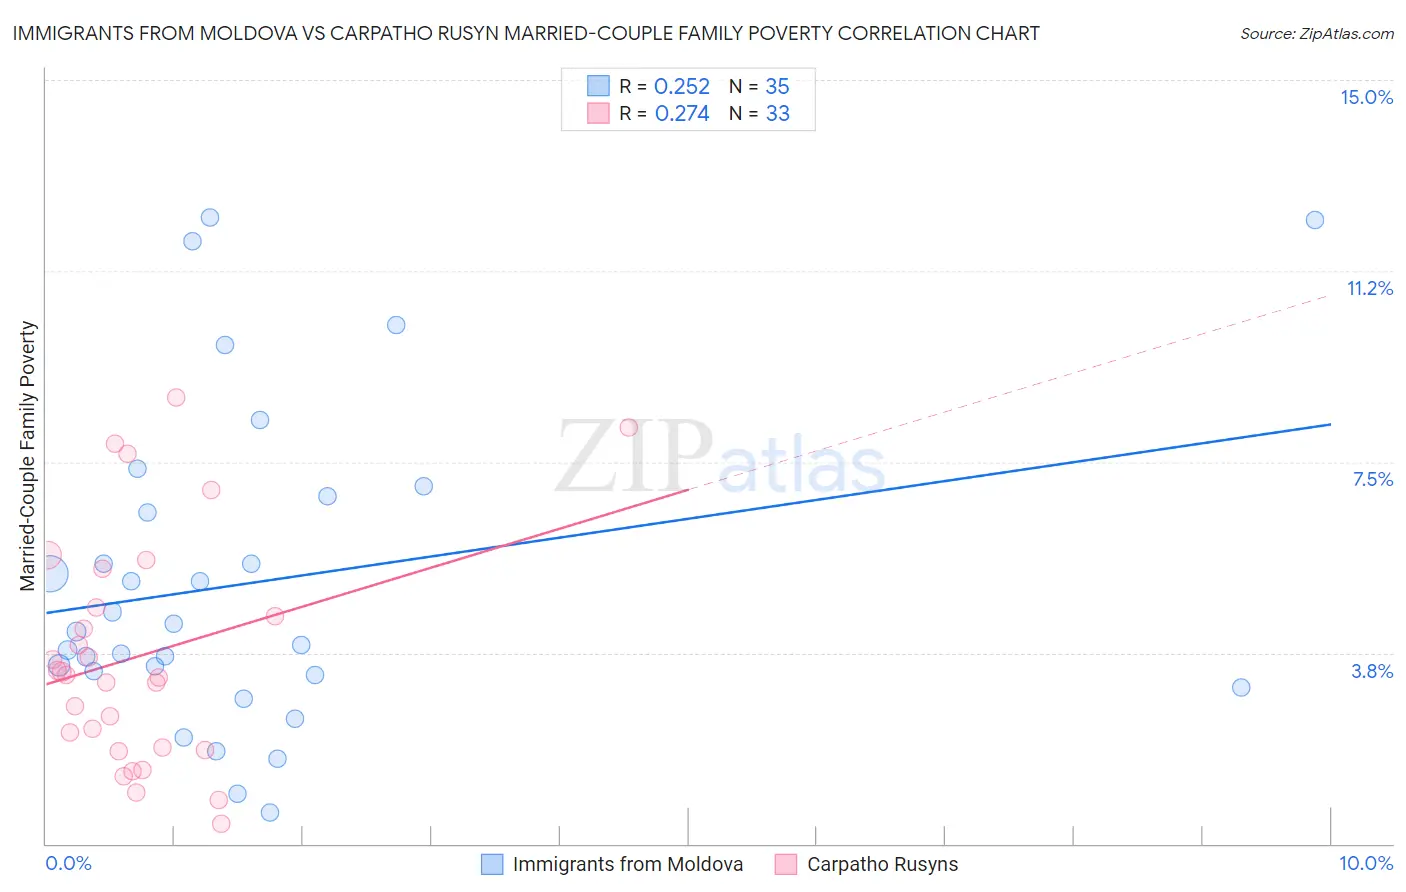
Immigrants from Moldova vs Carpatho Rusyn Married-Couple Family Poverty Correlation Chart
The statistical analysis conducted on geographies consisting of 124,083,541 people shows a weak positive correlation between the proportion of Immigrants from Moldova and poverty level among married-couple families in the United States with a correlation coefficient (R) of 0.252 and weighted average of 4.7%. Similarly, the statistical analysis conducted on geographies consisting of 58,607,667 people shows a weak positive correlation between the proportion of Carpatho Rusyns and poverty level among married-couple families in the United States with a correlation coefficient (R) of 0.274 and weighted average of 3.9%, a difference of 19.0%.
Married-Couple Family Poverty Correlation Summary
| Measurement | Immigrants from Moldova | Carpatho Rusyn |
| Minimum | 0.62% | 0.39% |
| Maximum | 12.3% | 8.8% |
| Range | 11.7% | 8.4% |
| Mean | 5.1% | 3.7% |
| Median | 4.2% | 3.3% |
| Interquartile 25% (IQ1) | 3.3% | 1.9% |
| Interquartile 75% (IQ3) | 6.8% | 5.0% |
| Interquartile Range (IQR) | 3.5% | 3.2% |
| Standard Deviation (Sample) | 3.1% | 2.2% |
| Standard Deviation (Population) | 3.1% | 2.2% |
Similar Demographics by Married-Couple Family Poverty
Demographics Similar to Immigrants from Moldova by Married-Couple Family Poverty
In terms of married-couple family poverty, the demographic groups most similar to Immigrants from Moldova are Aleut (4.7%, a difference of 0.070%), Immigrants from France (4.7%, a difference of 0.23%), Immigrants from Germany (4.7%, a difference of 0.24%), Immigrants from Romania (4.7%, a difference of 0.34%), and Laotian (4.7%, a difference of 0.50%).
| Demographics | Rating | Rank | Married-Couple Family Poverty |
| Immigrants | Belgium | 98.2 /100 | #97 | Exceptional 4.6% |
| Native Hawaiians | 98.0 /100 | #98 | Exceptional 4.6% |
| Immigrants | Europe | 97.9 /100 | #99 | Exceptional 4.6% |
| Immigrants | Western Europe | 97.9 /100 | #100 | Exceptional 4.6% |
| Yugoslavians | 97.8 /100 | #101 | Exceptional 4.6% |
| Asians | 97.6 /100 | #102 | Exceptional 4.7% |
| Immigrants | Romania | 97.3 /100 | #103 | Exceptional 4.7% |
| Immigrants | Moldova | 97.1 /100 | #104 | Exceptional 4.7% |
| Aleuts | 97.0 /100 | #105 | Exceptional 4.7% |
| Immigrants | France | 96.9 /100 | #106 | Exceptional 4.7% |
| Immigrants | Germany | 96.8 /100 | #107 | Exceptional 4.7% |
| Laotians | 96.6 /100 | #108 | Exceptional 4.7% |
| Immigrants | Hong Kong | 96.4 /100 | #109 | Exceptional 4.7% |
| Immigrants | Bolivia | 96.2 /100 | #110 | Exceptional 4.7% |
| Pakistanis | 96.2 /100 | #111 | Exceptional 4.7% |
Demographics Similar to Carpatho Rusyns by Married-Couple Family Poverty
In terms of married-couple family poverty, the demographic groups most similar to Carpatho Rusyns are Croatian (3.9%, a difference of 0.050%), Thai (3.9%, a difference of 0.49%), Lithuanian (4.0%, a difference of 0.51%), Latvian (3.9%, a difference of 1.0%), and Bulgarian (4.0%, a difference of 1.2%).
| Demographics | Rating | Rank | Married-Couple Family Poverty |
| Norwegians | 100.0 /100 | #3 | Exceptional 3.7% |
| Slovenes | 100.0 /100 | #4 | Exceptional 3.8% |
| Swedes | 100.0 /100 | #5 | Exceptional 3.9% |
| Luxembourgers | 100.0 /100 | #6 | Exceptional 3.9% |
| Latvians | 100.0 /100 | #7 | Exceptional 3.9% |
| Thais | 100.0 /100 | #8 | Exceptional 3.9% |
| Croatians | 100.0 /100 | #9 | Exceptional 3.9% |
| Carpatho Rusyns | 100.0 /100 | #10 | Exceptional 3.9% |
| Lithuanians | 100.0 /100 | #11 | Exceptional 4.0% |
| Bulgarians | 100.0 /100 | #12 | Exceptional 4.0% |
| Czechs | 100.0 /100 | #13 | Exceptional 4.0% |
| Slovaks | 100.0 /100 | #14 | Exceptional 4.0% |
| Poles | 100.0 /100 | #15 | Exceptional 4.0% |
| Germans | 100.0 /100 | #16 | Exceptional 4.0% |
| Filipinos | 100.0 /100 | #17 | Exceptional 4.0% |