Immigrants from Moldova vs Carpatho Rusyn Doctorate Degree
COMPARE
Immigrants from Moldova
Carpatho Rusyn
Doctorate Degree
Doctorate Degree Comparison
Immigrants from Moldova
Carpatho Rusyns
2.0%
DOCTORATE DEGREE
84.3/ 100
METRIC RATING
144th/ 347
METRIC RANK
2.3%
DOCTORATE DEGREE
99.8/ 100
METRIC RATING
69th/ 347
METRIC RANK
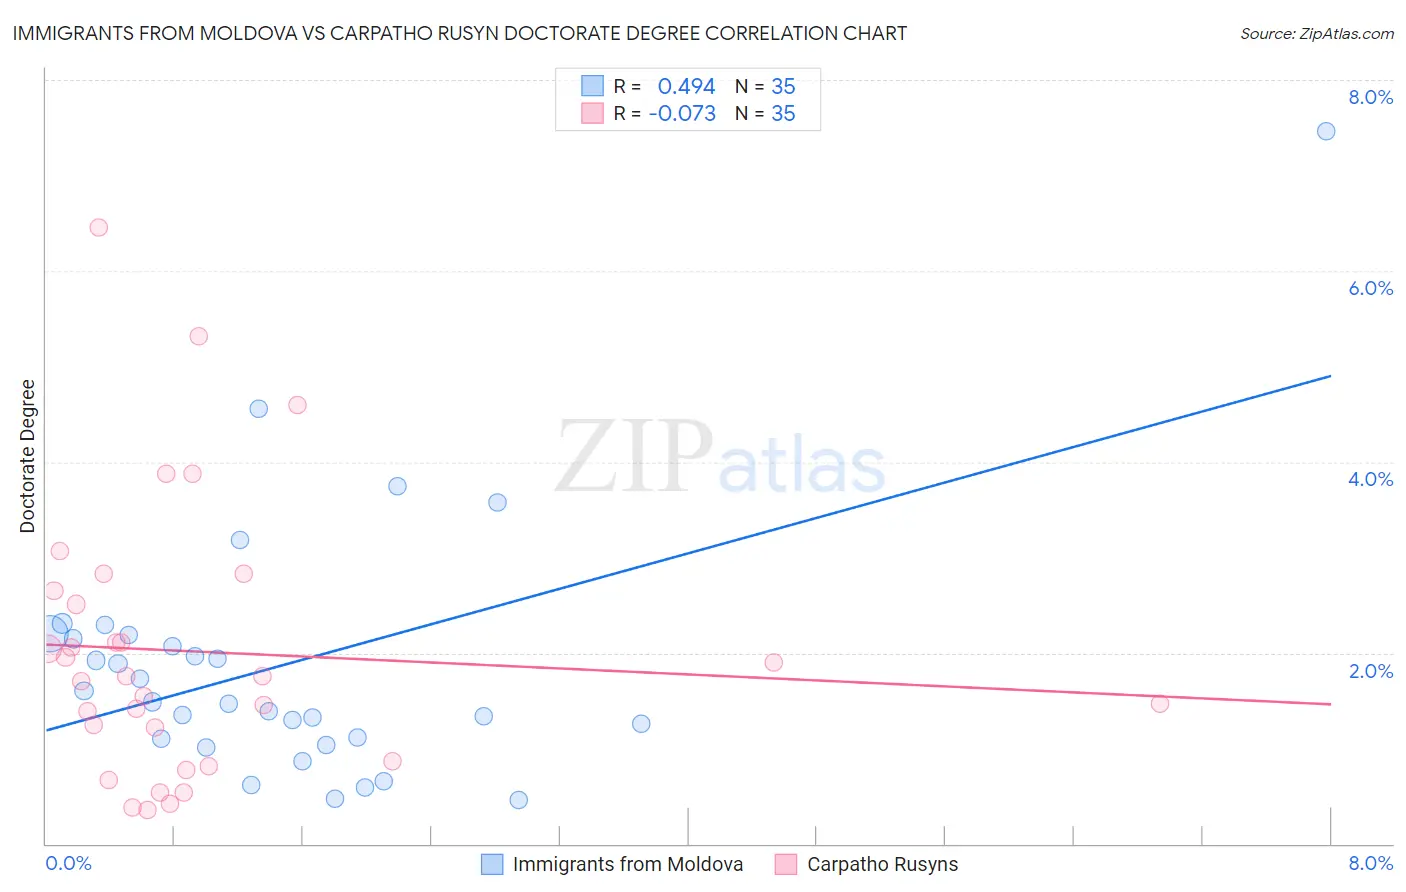
Immigrants from Moldova vs Carpatho Rusyn Doctorate Degree Correlation Chart
The statistical analysis conducted on geographies consisting of 124,175,458 people shows a moderate positive correlation between the proportion of Immigrants from Moldova and percentage of population with at least doctorate degree education in the United States with a correlation coefficient (R) of 0.494 and weighted average of 2.0%. Similarly, the statistical analysis conducted on geographies consisting of 58,704,885 people shows a slight negative correlation between the proportion of Carpatho Rusyns and percentage of population with at least doctorate degree education in the United States with a correlation coefficient (R) of -0.073 and weighted average of 2.3%, a difference of 15.8%.
Doctorate Degree Correlation Summary
| Measurement | Immigrants from Moldova | Carpatho Rusyn |
| Minimum | 0.45% | 0.35% |
| Maximum | 7.5% | 6.5% |
| Range | 7.0% | 6.1% |
| Mean | 1.9% | 2.0% |
| Median | 1.5% | 1.8% |
| Interquartile 25% (IQ1) | 1.1% | 0.86% |
| Interquartile 75% (IQ3) | 2.2% | 2.6% |
| Interquartile Range (IQR) | 1.1% | 1.8% |
| Standard Deviation (Sample) | 1.3% | 1.4% |
| Standard Deviation (Population) | 1.3% | 1.4% |
Similar Demographics by Doctorate Degree
Demographics Similar to Immigrants from Moldova by Doctorate Degree
In terms of doctorate degree, the demographic groups most similar to Immigrants from Moldova are Kenyan (1.9%, a difference of 0.18%), Immigrants from Syria (1.9%, a difference of 0.20%), Sierra Leonean (2.0%, a difference of 0.21%), Immigrants from Senegal (1.9%, a difference of 0.45%), and Italian (2.0%, a difference of 0.46%).
| Demographics | Rating | Rank | Doctorate Degree |
| South American Indians | 88.3 /100 | #137 | Excellent 2.0% |
| Swiss | 88.0 /100 | #138 | Excellent 2.0% |
| Afghans | 87.2 /100 | #139 | Excellent 2.0% |
| Immigrants | Africa | 87.0 /100 | #140 | Excellent 2.0% |
| Senegalese | 86.7 /100 | #141 | Excellent 2.0% |
| Italians | 86.0 /100 | #142 | Excellent 2.0% |
| Sierra Leoneans | 85.1 /100 | #143 | Excellent 2.0% |
| Immigrants | Moldova | 84.3 /100 | #144 | Excellent 2.0% |
| Kenyans | 83.6 /100 | #145 | Excellent 1.9% |
| Immigrants | Syria | 83.6 /100 | #146 | Excellent 1.9% |
| Immigrants | Senegal | 82.5 /100 | #147 | Excellent 1.9% |
| Luxembourgers | 81.1 /100 | #148 | Excellent 1.9% |
| Basques | 76.9 /100 | #149 | Good 1.9% |
| English | 75.9 /100 | #150 | Good 1.9% |
| Albanians | 74.8 /100 | #151 | Good 1.9% |
Demographics Similar to Carpatho Rusyns by Doctorate Degree
In terms of doctorate degree, the demographic groups most similar to Carpatho Rusyns are Lithuanian (2.3%, a difference of 0.14%), Immigrants from Bolivia (2.3%, a difference of 0.14%), Immigrants from Kazakhstan (2.3%, a difference of 0.25%), Immigrants from Canada (2.3%, a difference of 0.30%), and Immigrants from Bulgaria (2.3%, a difference of 0.38%).
| Demographics | Rating | Rank | Doctorate Degree |
| Immigrants | Europe | 99.9 /100 | #62 | Exceptional 2.3% |
| Laotians | 99.9 /100 | #63 | Exceptional 2.3% |
| Immigrants | Greece | 99.9 /100 | #64 | Exceptional 2.3% |
| Paraguayans | 99.9 /100 | #65 | Exceptional 2.3% |
| Argentineans | 99.9 /100 | #66 | Exceptional 2.3% |
| Zimbabweans | 99.8 /100 | #67 | Exceptional 2.3% |
| Immigrants | Kazakhstan | 99.8 /100 | #68 | Exceptional 2.3% |
| Carpatho Rusyns | 99.8 /100 | #69 | Exceptional 2.3% |
| Lithuanians | 99.8 /100 | #70 | Exceptional 2.3% |
| Immigrants | Bolivia | 99.8 /100 | #71 | Exceptional 2.3% |
| Immigrants | Canada | 99.8 /100 | #72 | Exceptional 2.3% |
| Immigrants | Bulgaria | 99.8 /100 | #73 | Exceptional 2.3% |
| Immigrants | North America | 99.8 /100 | #74 | Exceptional 2.2% |
| Immigrants | Western Asia | 99.8 /100 | #75 | Exceptional 2.2% |
| Immigrants | Hungary | 99.8 /100 | #76 | Exceptional 2.2% |