Immigrants from Cabo Verde vs Polish Married-Couple Family Poverty
COMPARE
Immigrants from Cabo Verde
Polish
Married-Couple Family Poverty
Married-Couple Family Poverty Comparison
Immigrants from Cabo Verde
Poles
5.3%
MARRIED-COUPLE FAMILY POVERTY
30.9/ 100
METRIC RATING
191st/ 347
METRIC RANK
4.0%
MARRIED-COUPLE FAMILY POVERTY
100.0/ 100
METRIC RATING
15th/ 347
METRIC RANK
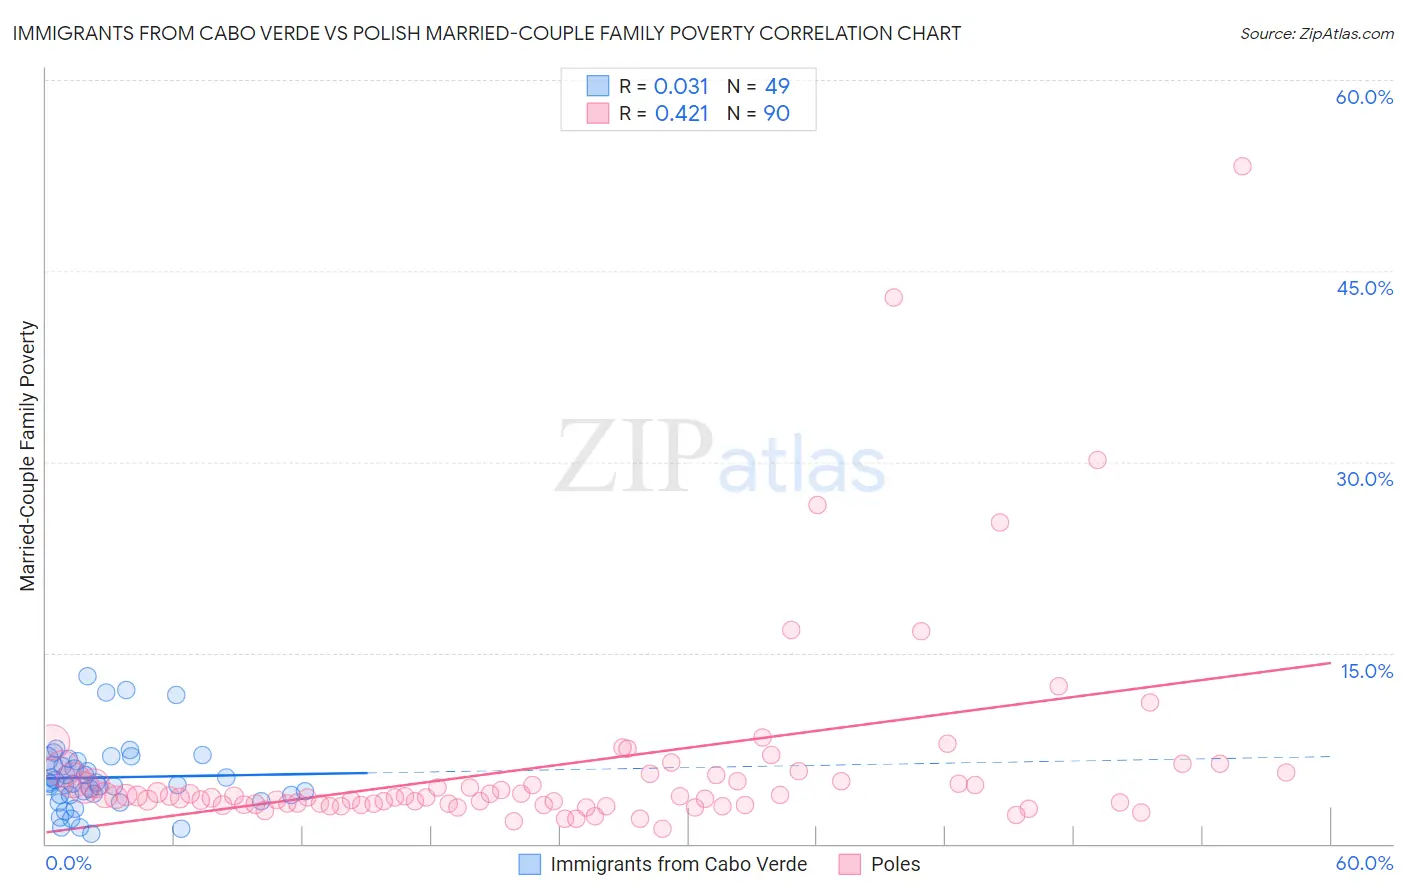
Immigrants from Cabo Verde vs Polish Married-Couple Family Poverty Correlation Chart
The statistical analysis conducted on geographies consisting of 38,016,283 people shows no correlation between the proportion of Immigrants from Cabo Verde and poverty level among married-couple families in the United States with a correlation coefficient (R) of 0.031 and weighted average of 5.3%. Similarly, the statistical analysis conducted on geographies consisting of 546,544,798 people shows a moderate positive correlation between the proportion of Poles and poverty level among married-couple families in the United States with a correlation coefficient (R) of 0.421 and weighted average of 4.0%, a difference of 32.7%.
Married-Couple Family Poverty Correlation Summary
| Measurement | Immigrants from Cabo Verde | Polish |
| Minimum | 0.81% | 1.1% |
| Maximum | 13.1% | 53.2% |
| Range | 12.3% | 52.1% |
| Mean | 5.2% | 6.2% |
| Median | 4.7% | 3.7% |
| Interquartile 25% (IQ1) | 3.8% | 3.1% |
| Interquartile 75% (IQ3) | 6.6% | 5.4% |
| Interquartile Range (IQR) | 2.8% | 2.3% |
| Standard Deviation (Sample) | 2.7% | 8.1% |
| Standard Deviation (Population) | 2.7% | 8.0% |
Similar Demographics by Married-Couple Family Poverty
Demographics Similar to Immigrants from Cabo Verde by Married-Couple Family Poverty
In terms of married-couple family poverty, the demographic groups most similar to Immigrants from Cabo Verde are Cape Verdean (5.3%, a difference of 0.030%), Ugandan (5.3%, a difference of 0.090%), Malaysian (5.4%, a difference of 0.19%), South American Indian (5.3%, a difference of 0.20%), and Israeli (5.3%, a difference of 0.29%).
| Demographics | Rating | Rank | Married-Couple Family Poverty |
| Immigrants | Nonimmigrants | 35.8 /100 | #184 | Fair 5.3% |
| Americans | 35.4 /100 | #185 | Fair 5.3% |
| Hungarians | 34.7 /100 | #186 | Fair 5.3% |
| Immigrants | Albania | 33.8 /100 | #187 | Fair 5.3% |
| Israelis | 33.1 /100 | #188 | Fair 5.3% |
| South American Indians | 32.5 /100 | #189 | Fair 5.3% |
| Ugandans | 31.6 /100 | #190 | Fair 5.3% |
| Immigrants | Cabo Verde | 30.9 /100 | #191 | Fair 5.3% |
| Cape Verdeans | 30.7 /100 | #192 | Fair 5.3% |
| Malaysians | 29.5 /100 | #193 | Fair 5.4% |
| Immigrants | Israel | 27.8 /100 | #194 | Fair 5.4% |
| Immigrants | Azores | 27.5 /100 | #195 | Fair 5.4% |
| Spaniards | 27.4 /100 | #196 | Fair 5.4% |
| Liberians | 26.3 /100 | #197 | Fair 5.4% |
| Immigrants | Belarus | 26.2 /100 | #198 | Fair 5.4% |
Demographics Similar to Poles by Married-Couple Family Poverty
In terms of married-couple family poverty, the demographic groups most similar to Poles are Slovak (4.0%, a difference of 0.030%), Czech (4.0%, a difference of 0.070%), German (4.0%, a difference of 0.27%), Filipino (4.0%, a difference of 0.30%), and Italian (4.0%, a difference of 0.31%).
| Demographics | Rating | Rank | Married-Couple Family Poverty |
| Thais | 100.0 /100 | #8 | Exceptional 3.9% |
| Croatians | 100.0 /100 | #9 | Exceptional 3.9% |
| Carpatho Rusyns | 100.0 /100 | #10 | Exceptional 3.9% |
| Lithuanians | 100.0 /100 | #11 | Exceptional 4.0% |
| Bulgarians | 100.0 /100 | #12 | Exceptional 4.0% |
| Czechs | 100.0 /100 | #13 | Exceptional 4.0% |
| Slovaks | 100.0 /100 | #14 | Exceptional 4.0% |
| Poles | 100.0 /100 | #15 | Exceptional 4.0% |
| Germans | 100.0 /100 | #16 | Exceptional 4.0% |
| Filipinos | 100.0 /100 | #17 | Exceptional 4.0% |
| Italians | 100.0 /100 | #18 | Exceptional 4.0% |
| Immigrants | Ireland | 99.9 /100 | #19 | Exceptional 4.1% |
| Maltese | 99.9 /100 | #20 | Exceptional 4.1% |
| Zimbabweans | 99.9 /100 | #21 | Exceptional 4.1% |
| Immigrants | Singapore | 99.9 /100 | #22 | Exceptional 4.1% |